FEATURED BLOG

Susan Rantall

Recent Posts

10 Ways Your Equipment is Trying to Tell You It's Time for Root Cause Analysis

Posted by Susan Rantall on Sun, Jul 12, 2015 @ 03:07 AM

Author: Jack Jager

While there are three main reasons organizations typically perform Root Cause Analysis (RCA) following an issue with their asset or equipment, there are a whole host of other indicators that RCA should be performed. bigstock-Worker-in-caution-sign-icon-th-92706563

Odds are, you’re recording a lot of valuable information about the performance of your equipment - information that could reveal opportunities to perform root cause analysis, find causes, and implement solutions that will solve recurring problems and improve operations. But are you using your recorded information to this extent?

First, let’s quickly talk about three reasons why root cause analysis is typically performed. 

1. Because you have to

There may be a regulatory requirement to demonstrate that you are doing something about a problem that’s occurred.                                    

2. You have breached a trigger point

Your own company has identified the triggers for significant incidents that warrant root cause analysis. 

3. Because you want to

An opportunity has presented itself to make changes for the better. Or perhaps you’ve decided you simply don’t want to lose so much money all the time.

At the core of all industry is the desire to make money. Anything that negatively impacts this goal is usually attacked by performing root cause analysis.

I was having a conversation with a reliability engineer at an oil and gas site, and I asked him what lost opportunity or downtime might cost that company over the course of a year. He said it was in the vicinity of three quarters of a billion dollars. $750,000,000. Is this a good enough reason to perform root cause analysis? Even a 10% change would have a huge impact on bottom line figures.

The monetary impact to the business was of course not due to any single event, but to a multitude of events both large and small.

Each event presents itself as an opportunity to learn and to make any changes necessary to prevent its reoccurrence. Once can be written off as happenstance… things happen, serious or minor, and that’s life. But to let it happen continuously means that something is seriously wrong.

While these are all valid reasons to perform root cause analysis, there are at least ten more tell-tale equipment-related clues that an RCA needs to happen – most of which can be identified through the information you’re probably already recording.

Here are ten tell-tale signs that your organization needs to perform Root Cause Analysis:

  1. Increased downtime to plant, equipment or process.
  2. Increase in recurring failures.
  3. Increase in overtime due to unplanned failures.
  4. Increase in the number of trigger events.
  5. Less availability of equipment.
  6. High level of reactive maintenance.
  7. Lack of time… simply can’t do everything that needs doing.
  8. Increase in the number of serious events… nearing the top of the pyramid.
  9. Longer planned “shut” durations.
  10. More frequent “shut” requirement.

These indicators imply that we need to be doing more in the realm of root cause analysis before these issues snowball.

If you can identify with some of these pain points, download our eBook “11 Problems With Your RCA Process and How to Fix Them” in which we provide best practice advice on using RCA to help eliminate some of these problems.

11Problems_Ebook_banner

Auditing Your RCA Investigation - Free Score Sheet Template Included

Posted by Susan Rantall on Wed, Jun 17, 2015 @ 07:06 AM

Author: Kevin Stewart

RCAInvestigationScoreSheet_Mock-up

Audit is defined in the Merriam-Webster dictionary as:  “a methodical examination and review.” When we talk about auditing your Root Cause Analysis (RCA) investigations, we mean just that -- a methodical examination and review. This is easier said than done, especially without some sort of standard to gauge against. If we establish a standard by which we gauge the quality of an RCA, the audit then becomes a simple matter of checking the RCA against the accepted standard and then determining how well it meets that standard. This post is all about helping you establish a standard, and we’ll even give you a free score sheet template to get you started.

Could you have the worst-looking RCA in the world and meet none of the criteria, but have an effective solution that: 

  • prevents reoccurrence,
  • meets our goals and objectives,
  • is within our control, and
  • doesn’t cause other problems?

Sure, and it is hard to argue with success. I doubt anyone would say: “Even though this solution will prevent the problem from recurring, it comes from an RCA that doesn’t meet our stringent, high-quality metrics so we can’t use it.” This scenario is entirely possible, though the odds of it are unlikely. If we have a set of measures to check an RCA against to ensure it meets some quality standards, the probability of an effective solution coming from that RCA is greatly increased. 

So what characteristics of an RCA are important?

Here are some questions to consider: 

(If you need a refresher on some of these points, I’ve included the relevant page numbers from the eBook “RealityCharting™: Seven Steps to Effective Problem-Solving and Strategies for Personal Success” by Dean L. Gano.)

  • Do the causes pass the noun-verb test? (page 83)

noun-verb_relationships

  • Do the causes have a lot of unnecessary words or descriptors?
  • Do the causal elements pass all logic tests? (page 108)
    • Space-Time Logic Check 
      • Do the causes of this effect exist at the same time? 
      • Do the causes of this effect exist in the same place?
    • Causal Logic Check
      • If you remove this cause, will the effect still exist?
        If the answer to this question is no, then the cause is necessary for the causal relationship and should stay on the chart. If the answer is yes, it should be removed or repositioned.
  • Are there any rule violations? If so, what are they and do they pass the minimum standards? Rules to be included are:
    • Are any of the cause boxes empty?
    • Are there any unconnected causes floating around in the chart?
    • Has each cause been identified as an action or condition?
    • Does each effect meet the 2nd principle (causes exist in an infinite continuum – there is an action and a condition for each effect)?
    • Have all conjunctions been eliminated? Remember that “and” is often interpreted to mean “caused,” which can leave too much room for misunderstanding and error. (pages 67-68)
    • Does each cause have the appropriate supporting evidence to justify its inclusion in the chart?
    • Does each branch have some type of stop identified for it? Below are the five potential stops: (pages 88-89)
      • Question Mark – more information needed; an Action Item is created.
      • Desired Condition – there is no need to keep asking why.
      • Lack of Control – something over which you or your organization have no control, for example “laws of physics.”
      • New Primary Effect – a separate analysis is required.
      • Other Cause Paths More Productive – continuing down this path would be a waste of time.
  • Does the solution matrix fall into a typical mix such as:

AuditingYourRCA_Graphic

  • Have the solutions been judged against a standardized set of criteria with standard ranges to minimize the possibility of favorite solutions being chosen? (page 118-120)
  • Has each solution been assigned to a team member and given a due date?
  • Does the chart meet all of the four principles of causation? (page 36)
    • Causes and effects are the same thing.
    • Causes exist in an infinite continuum.
    • Each effect has at least two causes in the form of actions and conditions.
    • An effect exists only if its causes exist in the same space and time frame.
  • Does the problem definition establish a clear dollar value significance that will let management make informed choices and approvals?
    • If a dollar value is not appropriate (safety near miss or potential fatality) does the problem definition establish a significant value?
  • Have all of the action items been resolved? (Action items can include areas where more information is needed, there are evidence issues, or any manually entered items need to be resolved and deleted.)

The next step in developing an audit is to generate a checklist that your RCA will be gauged against.

This list can come from the items above, your own list, or a combination of the two. Once you have a list of items to audit against, you need to generate a ratings scale. This can be a pass/fail situation or a scale that gives a rating from 0 to 5 for each item. This can allow you to give partial credit for some items that may not quite meet the full standard.

Develop a score sheet with each item listed and a place to put a score for each one. Don’t forget to leave a space for notes from the reviewer to explain the reasons for partial credit. It’s handy to add some guidelines with each item to give the reviewer a gauge to score the item against. A sample of such guidelines might look like:

0 = Does not exist
1 = Some are in place but not correct
2 = Many are in place and some are correct
3 = All are in place but only some are correct
4 = All are in place and most are correct
5 = All are in place and correct

With guidelines like these easily available as a reference on your score sheet, it helps ensure consistency in the scoring, especially if multiple people will be scoring an RCA.

Now all you have to do is review an RCA against your list, score it, and have some sort of minimum for passing.

This will ensure that each RCA is measured against a consistent standard that can be repeated by multiple people, though there will always be differences if multiple people are auditing RCAs. Differences can be minimized by either having only one person doing the audit or calibrating the audit, or by bringing all personnel together and scoring several as group so that all auditors understand the scoring nuances.

While I’ve provided a pretty thorough list of what to check for when auditing an RCA, my experience is that an RCA can meet all of the requirements above and still have some issues. The biggest one is that the logic may be correct but the causes may not, so the RCA can pass the tests but it won’t actually fix the issue. The fact is, humans are involved and we make mistakes. Sometimes the errors can be caused by inexperienced investigators that need more practice. Other reasons for error are some of the filters that we talk about, such as time constraints, preconceived notions or biases, language issues, etc. This means that there is still a component that needs to be reviewed by someone for general integrity and for things that a computer just can’t look for. This person can be an external corporate person, a contractor, or an internal resource.

RealityCharting™ has tools that are available to the reviewer to assist them in critiquing the analysis such as rules check, action item report, causal element view, and most importantly there is a dashboard.


RCAInvestigationScoreSheet_Mock-up


FREE Instant Download

To assist you in creating your RCA score sheet, we’re offering a free template.

Incorporating Alternate Realities Into Your RCA - Science Fiction or Just Good Business?

Posted by Susan Rantall on Fri, May 29, 2015 @ 00:05 AM

bigstock-different-points-of-view

Author: Kevin Stewart

Oftentimes our differences can be a source of conflict and confusion, but in this article I’d like to explore how they can be harnessed to solve problems rather than create them.

“Everything will be fine if you’ll just do it my way.” At some point we have all probably said or thought something like this. Or maybe you’ve heard it from someone else (quite possibly your significant other). What is the underlying feeling or issue here? What we’re really saying is: “If everyone was just like me and thought the way I did, everything would be fine.” Of course, this is impossible. Neuroscience research tells us that no two brains are exactly alike, and to quote an article from Scientific American on this topic, “…if the apparatus that senses the world differs between two individuals, then the conscious experience of the brains wired to these sensors cannot be the same either.”[1] 

Good problem solvers need to be aware of this so they don’t fall into the trap of assuming that everyone knows what everyone else knows, or that everyone interprets information in the same way. I was channel surfing one day and spotted an interesting show about conjoined twins who share one body and most organs, but have completely separate heads (and therefore brains). When the interviewer posed a question, each twin responded in turn with different answers. This caused an ensuing disagreement between them.

These two people had as identical an upbringing and exposure to life and environmental factors as is humanly possible and yet they still thought differently.  If that doesn’t convince you that it’s impossible for two different brains to share the same perspective, I’m not sure what will!

Here’s an example of how two people can be having a conversation about the same thing and yet not be talking about the same thing at all. During a common exercise in one of my classes, a rousing discussion started about cleaning fish. Everyone except one bright student seemed to be on the same page. Everyone else got the feeling that this person was just being difficult, but something inside reminded me to get more information. After a few probing questions we discovered that we did not have the same perspective on the issue. This person had never been fishing and did not understand that “cleaning fish” implied gutting and preparing it for consumption. She couldn’t understand the exercise because her perspective of cleaning was to wash and in general clean the outside, so what did a knife have to do with it!

One more personal observation to cement this issue is a discussion I had with colleagues about the “Hierarchy of Controls” (pictured below for reference). 

Pyramid_ARMSColoursOne colleague stated that another must understand this concept since he has an engineering background, and all engineers would know this. I had to inform them that I also have a 30-year background in engineering, maintenance, and reliability but actually had never been exposed to the term either. So once again, the impossible situation of everyone’s perspective being identical rears its head.

While doing your root cause analysis, keep the perspective issue in mind. Ensure that you formulate the problem definition so that each perspective has a chance to be heard, and that the problem is a reflection of all of the perspectives of the team. While doing the root cause analysis, some may not speak up in the meeting but will have a different perspective, so as a facilitator it is your job to draw it out and ensure it gets voiced.

In my experience it can have a significant impact on a team’s understanding of a particular cause. Though sometimes we might wish everyone saw things exactly as we do, allowing for others’ alternate realities is actually key to building a more complete picture of your problem, thereby allowing you to find the best solution.

[1] http://www.scientificamerican.com/article/think-different-jan-11/

publictraining

Topics: root cause analysis, rca success, root cause analysis tips

5 Ways to Maximize Gains from Your Root Cause Analysis Program

Posted by Susan Rantall on Wed, Apr 01, 2015 @ 05:04 AM

LionChasingGazelle

The lion and gazelle have to be at the top of their game each and every day. If they get lazy, they lose.

The Apollo Root Cause Analysis methodology can help you maintain a competitive advantage, but only if you use it completely and consistently.

How are you ensuring that you maintain and improve your lead?

Can you measure what you have achieved since your Apollo Root Cause Analysis methodology training, or has it become just another initiative that didn’t work?

You spent the time and effort learning a proven methodology that solves event-based problems every time, and perhaps it has become a company standard tool. But the creation of the reality chart and incident report are only steps on the journey. We also need to focus on creating an effective problem-solving culture (for alumni: page 109 in your manual). The culture part of the equation can be easy to overlook, but it is this holistic approach that will help you get the most out of the Apollo Root Cause AnalysisTM method.

If we do nothing after the initial implementation of the Apollo Root Cause Analysis methodology, entropy kicks in and the system begins to unravel. Any shortfall from the potential gain becomes considered “normal” and root cause analysis just gets accepted as another initiative that didn’t work.

10TonneEntropy_Graph

With this in the back of our minds, we have to put supports in place to develop a solid platform on which incremental change can be applied to achieve ever greater gains.

10TonneEntropy_Graph2

To help enhance your company’s problem-solving culture and get maximum benefit from your Apollo Root Cause Analysis program:

1) Ensure your senior leadership team is fully aware of your efforts.

Try to get an influential sponsor to regularly mention root cause analysis in group communications. Remember that everyone’s reality is different, so time and energy spent with this team creating that common reality is going to pay dividends.

2) Implement Leader Standard Work.

(See chart below for an example) This ensures the ball is kept rolling from leadership down the chain. Developing formal, measured business processes can really help with this, along with good visual management tools.

*HOD = Head of Department

LeaderStandardWorkExample

3) Increase awareness of the benefits and gains brought about by your successes.

Celebrate the gains!

4) Involve union and safety reps.

If this is done correctly, these folks can be your biggest evangelists. You can then use them as a resource. The “No Blame” approach of the Apollo Root Cause Analysis methodology should make it easier to sell.

5) Create a robust, visible, and measured action tracking system.

Unlike work orders that are in a CMMS, these actions have a tendency to fade away. Ideally you would create one place for all actions, making them easy to prioritize. 

Ultimately, you have to use it or lose it and these five tactics have the potential to help a great deal towards establishing a problem-solving culture and embedding it into an organization. 

Apollo_-_Webinar_banner

Calculating the ROI of Root Cause Analysis in Terms of Safety

Posted by Susan Rantall on Thu, Feb 05, 2015 @ 09:02 AM

ROI_on_RCA_for_Safety_blog_imageAuthor: Kevin Stewart

At some point, most companies will want to see quantifiable metrics showing that their Root Cause Analysis (RCA) program has resulted in a positive return on investment (ROI).

ROI is relatively easy to calculate as a dollar value when it comes to tangibles such as equipment or production time. Things can seem trickier when trying to assign a dollar value to safety improvements resulting from an RCA program. Try to keep it simple.

This formula -

Cost of the Problem x Likely Recurrence / Cost of the Fix = ROI

is a straightforward way to begin quantifying the ROI of your RCA program, including its effects on safety.

Let’s look at how we might calculate these costs. 

Cost of the Fix

  • Cost of an RCA investigation (you may need to include the initial training, though this should drop off as it is amoritized out over the program, as well as whatever time, resources, and people are required to conduct the investigation itself).
  • Cost of whatever resources are needed to implement a solution. Don’t forget to include new equipment, parts, additional training, and anything else that is directly attributable to the implementation.

When you eliminate a problem, calculating what you have saved depends a lot on the problem itself and what its rate of reoccurrence is. For instance, if you figure out what was causing a particular machine to fail at a rate of once/year, you won’t see the benefits of your solution for another year. It can take several years and solving many different problems to see the total value of an RCA program. 

Improved safety isn’t as impossible to quantify as it might seem. While most companies don’t publicly discuss this type of equation because it can seem insensitive, chances are your company does calculate the monetary cost of an injury or death on the job. These figures may be a bit outdated, but the Mine Safety and Health Administration at the US Department of Labor offers an online calculator, which takes into account both direct costs (like workers’ comp claims) and indirect costs (like training a new worker and lower morale), as one example.

Cost of the Problem Reoccurring

Cost of the initial problem in equipment, production delays, man hours, workers’ comp claims, medical costs, absenteeism, turnover, training new employees, lower productivity, decreased morale, legal fees, increased insurance costs.

At first glance the equation doesn’t quite make sense for a safety “near miss.” If it missed then what did it cost? Is the answer nothing? So the ROI is:  0 x likely recurrence/cost of the fix = 0? The answer obviously must include the potential cost. The cost to the business if the issue was on target and hadn’t missed. It all becomes subjective then. How do you put a cost on maybes? 

It might help to look at the statistics of how an incident occurs. Take the cost to the business if a single major accident occurred (every business has this unspoken cost locked away somewhere) and then very simply do the math. One near miss will be worth 0.003 of that cost. Tally up your near misses and now go back to the formula.

AccidentPyramid_V2

As an example, say your data indicates you have 3000 near misses in two years, or 4.1 incidents per day. Then you put a program in place and now you have 3000 near misses in four years, or 2.1 incidents per day. This translates to 3000 fewer near misses in two years time. Per the above calculations, this would generate 3000 x 0.003 or nine fewer major incidents at whatever cost your company assigns to that type of incident. This becomes the savings for your ROI (or the Cost of the Problem in our equation) and can be attributed to the safety program of which the RCA process is a part.

This formula will assist in calculating an ROI on an individual RCA, which is necessary to show that the process is working and providing value so you can justify the program. However, since most safety programs track TRIR (Total Recordable Injury Rate) or something to that effect, you will also need to show that the RCA program affects this, too. This will be difficult because the safety program is in place and doing other things to prevent safety incidents before they happen. How do you attribute a reduction in near misses to preventive programs versus items put in place from an RCA?

You may never be able to separate these items. Even with detailed records, it is not always clear why people do what they do. The best thing you can do is to track when an RCA program was incorporated and then show the improvement in your safety metric, in TRIR, or near misses. 

You can use this information to justify the program with the argument that the RCA process is part of the overall safety program and it really doesn’t matter which gets the credit as long as we have continued to drive safety improvements. The RCA program should be a small part of the overall safety program costs since there are usually several full time safety people involved, committee meetings, safety initiatives, programs, etc.

It doesn’t matter how you slice and dice it, the return on investment for your RCA program boils down to: What will it cost me to fix the problem now? – versus – What is the cost if this problem happens again?


training_footer 

2 Simple Methods to Improve Your RCA Charts

Posted by Susan Rantall on Sat, Oct 26, 2013 @ 03:10 AM

By Jack Jager and Michael Drew

root cause analysis
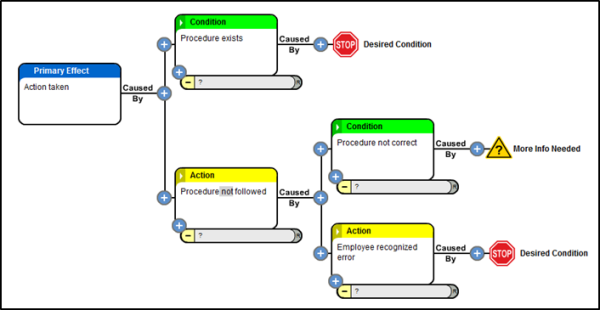
The RealityChart™ (cause-and-effect chart) that you generate during a Root Cause Analysis investigation is important as it creates a common understanding of why the problem has occurred.

Creating your RealityChart™ starts with finding the causes that contributed, or played a part, in the event or problem that occurred. During this phase of the analysis, the chart serves as the interactive platform where all of the information is captured, recorded, and organized. The chart should be highly visible so that all group members can see and comment on it.

(Tip: If you build your initial chart using “Post-It®” notes, attaching them to a vertical surface is best. Use dark coloured, thick marker pen for writing. This simply makes the information more readable. If you want to move your chart, post the notes on a roll of brown paper which can be rolled up and moved. Using RealityCharting™ allows the chart to be shared electronically)

The second challenge in the creation of the RealityChart™ is to arrange the causes in a meaningful, logical way that other people can follow and understand. The crucial point here is whether other people can understand the chart, not just you. This is the real litmus test for the chart and can be a challenge. Whilst you may believe that your chart is sound, if other people can’t follow it then it might possibly be subjected to scrutiny, be dissected at every turn, and perhaps even be dismissed if believed to be an inaccurate representation of the problem. Be prepared as others view your chart to listen to what they think, you may discover alternative paths or additional causes that you or the team could not see.

So, to ensure your chart is a good representation of the problem analysis, challenge your charts and be open to other views.

How do you do that?
I’m going to tell you about two ways – Testing your logic and applying “rules check”.

1) Test your logic

Remember there are three important things about charts – Logic, Logic, and Logic! If the logic is sound then the connection should be logical in both directions. What I mean is, if A is caused by B and C, then the converse of this must also be true - B and C cause A.

If you use this test and the statement doesn’t ring true then the connection needs to be changed so that it becomes logical.

Here’s an example.

How often have you heard that you have a “failed bearing” and that this is caused by a “lack of lubrication”? Now whilst this may be true, and it does have the semblance of a logical connection, there is much that happens in between these two causes.

How does it sound when you state the connection the opposite way: Whenever you have a lack of lubrication, you will have a failed bearing. Now this just doesn’t sound right. It is not always true. This understanding indicates that there are other causes that have yet to be found.

What happened to the causes of “metal to metal contact”, “generation of heat”, “expansion of metal”, “narrow tolerances”, “bearing in use”, “lack of monitoring”, “no tripping mechanism”, “extreme heat”, severe duty and so on? There is a lot more information here than meets the eye.

A lack of lubrication itself does not cause the bearing to fail - not instantaneously. A lot of things happen before you have catastrophic failure of the bearing. So the initial statement that you have a “failed bearing” being caused by a “lack of lubrication” is far too simplistic. It is a generalisation that requires a lot of assumptions to be made.

Your job is to present the facts in a logical arrangement rather than allowing or forcing people to make guesses based on insufficient information. The adding of more specific details (even what some people consider to be superfluous detail) can be very beneficial in facilitating this. It is the detail that allows comprehensive understanding of your chart.

2) Apply the “Rules Check”

When using the Apollo Root Cause Analysis methodology, your RealityChart™ must have:

Evidence to support each of the causes.
This validates the information which gives the chart credibility.

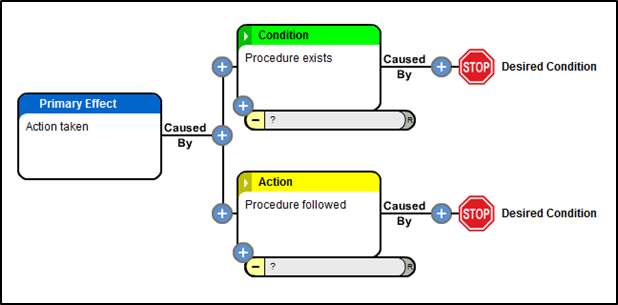
Stop points indicated and a reason for stopping also provided.
This indicates to everyone that you have stopped asking questions on that causal path and have provided a valid reason for doing so. When all cause paths have been completed in this manner, then the chart is finished.

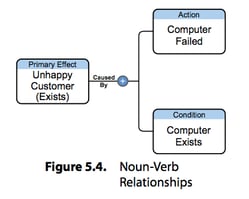
Causes should be labelled as either actions or conditions.
This helps you to see what type of causes you have found and therefore what may have been missed. It drives the questioning process to another level.

Each connection should have a least one action and also one condition.
Though typically we see more conditions than actions, we should never see a straight line of causes within a chart. This too should generate the asking of more questions.

Any anomalies or violations to these “rules” should demand that another question be asked. The anomaly, or violation, must be challenged.

It is the challenge that is important. Challenging the cause and effect charts consistently will improve the quality of the charts. It is about dotting the “I”s and crossing the “T”s. That said, there is no such thing as a correct chart – they are always a work in progress. They are rarely if ever “perfect”.

The initial chart should be considered a draft and is a direct reflection of the information you have available and the amount of time that you have to organize and challenge it. As the chart continues to develop, challenge it constantly using the logic test and the rules check.

Significantly, a quality chart will enable you to demonstrate the effect that your corrective actions will have on the problem or event. If you eliminate or control a cause that forms part of a causal relationship, then whatever happens after that point is effectively prevented from occurring and you can demonstrate this very effectively by referring to a detailed, logical chart.

Added benefits:

  • Once a quality chart has been produced for a systemic, recurring failure, that chart could be used as a template and rolled out when similar failures occur. Then, it’s a matter of challenging the chart to see if the information is all correct.

    How much time would this save your organization in investigations? How much time would it save your organization to solve systemic issues that are eliminated?

  • A “quality” chart can be a learning tool. It can be shared amongst colleagues as a resource that shows what to look for when similar problems arise.

Summary

A RealityChart™ is a dynamic view of the logical cause and effect relationships that represents the logic as to why a problem has occurred. They can be shared, challenged and changed over time. They lead to effective solutions for one off and systemic problems.

Demand excellence in your charts. The effort in trying to achieve this will be time well spent.

Root Cause Analysts Tips & Tricks - 101 Ways to improve your RCA Investigations

Posted by Susan Rantall on Wed, Sep 25, 2013 @ 00:09 AM


Our latest eBook gives you access to all our top tips for conducting better root cause analysis investigations.

101 Root Cause Analysis Tips

We've covered root cause analysis from start to finish:

  • Gathering information

  • Assembling the team

  • Conducting the RCA

  • Implementing the solutions

  • Measuring the success of the corrective actions

  • Advertising your successes

  • Plus, a whole section of tips for the RCA facilitator

Get My Copy

Topics: root cause analysis, rca skills, rca facilitation, root cause investigation, critical rca skills, root cause analysis tips

Does your Continuous Improvement Model have Problem Solving at its core?

Posted by Susan Rantall on Thu, Aug 01, 2013 @ 07:08 AM

By Kevin Stewart

continuous improvement model
Continuous improvement is basically getting better than you were in the past.  So, how is something better than it was in the past?

In my mind it is associated with more, better, and faster.  In other words: I make more products with the same work, or I get a better quality product with the same work, or I can work faster with the same effort and therefore make more products and reduce my unit cost. 

In each case there may be a barrier, bottleneck, or something preventing you from making the improvement. While Root Cause Analysis is not always the right tool to resolve that barrier or bottleneck, it should be a foundation tool in the process of continuous improvement.  

I believe that a facility’s or a person’s continual success is directly dependent on their ability to solve problems.  

In Ron Moore’s book entitled “Making Common Sense Common Practice” he discusses three companies - an “A” company, a “B” company, and a “C” company. In his description, “A” company is the best of the best and “C” company is the one always lagging toward the back of the pack - making money in good times and struggling or failing in the tough times. Company “B” is in the middle of the pack.

Here’s a quote from his book:

“The difference between the best companies and the mediocre/ poor [companies] in this model is the emphasis the best companies give to the denominator (unit cost = cost/capacity).  That is, they focus on maximizing the capacity available through applying best practices and assuring reliability in design, operations and maintenance, and through debottlenecking.  They then use that capacity to go after additional market share, with little or no capital investment.  Note that in doing this, they also minimize the defects which result in failures and additional costs.”

The sentence in bold above is essentially saying that they aggressively follow a continuous improvement model of some kind to achieve that focus.

There are many tools available to a practitioner who is focused on continuous improvement. However, in my experience coming from an industrial environment, effective problem solving has one of the highest returns for the dollars and time spent of any of the tools.

This is not to say that the other tools mentioned in Ron’s book are not valuable – in fact I spent a large portion of my career attempting to establish and institutionalize those tools and processes. But every time something doesn’t meet expectations, or your downtime is greater than expected, or a piece of equipment can’t provide the uptime you need, that is the definition of a problem that needs resolution.

Also, in my career I discovered that many of the continuous improvement tools would not work well unless some of the more blatant and repetitive problems were resolved first. The most visible of these is planning and scheduling. Trying to plan and schedule in a reactive environment is next to impossible because every time you try to schedule a job, it gets usurped by a failure somewhere. This is frustrating for everyone and leads to an uphill battle.

So I believe that if you look deep inside an “A” company you will find a continuous improvement model that supports problem solving at its core.

Many people would say that Toyota is such a company; and they have many tools at its disposal - one of them being the 5 Whys. This is simply a problem solving methodology that allows operators and others to fix problems at the appropriate level, thereby supporting their continuous improvement model. The 5 Whys problem solving tool was developed to support Toyota’s original foundation premise of “Eliminate Waste” which is basically what Ron Says the “A” companies are doing. They are solving problems by identifying causes for the waste and then putting in place solutions to eliminate it.

If you think about the automotive industry as an example, are they driven by continuous improvement due to competition?

Do you remember when you had to replace or set the points in a distributor on a regular basis?  

Nowadays, through continuous improvement, there is no wear and electronic ignition has all but eliminated the need for that task…thereby eliminating waste and putting the original auto manufacturers ahead. The others had to follow suit in order to not lose market share or reputation.

The same thing happened with spark plugs. I haven’t change a set in quite a while since they started lasting 100,000 miles. You could make the case that it has cost companies money since they don’t sell parts anymore, however, I think anyone that didn’t move with these new technologies would have been left in the dust and lost market share.

As illustrated in the above examples, the best of the best are driven by continuous improvement to stay ahead of the game or to catch up quickly – no matter what the industry. This status is achieved through a combination of tools and problem solving techniques, with cause and effect being one that, in my opinion, should be at the core of your continuous improvement model.


Webinar Elements to Sustain a RCA Program


Root Cause Analysis Template: Can one size really fit all?

Posted by Susan Rantall on Fri, Jul 19, 2013 @ 06:07 AM

By Kevin Stewart

root cause analysis template

Wouldn’t it be great if problems presented themselves in a manner that would allow
them to perfectly fit a standard root cause analysis (RCA) template or process so that we could just plug in a few details and say “Voilà, here is the answer”?
 

Or even if they were close enough for us to adapt a standard template to allow us to quickly modify a standard analysis and come up with a reasonable standard answer? Life would be great!

If we look up “template” in the dictionary we get: “something that establishes or serves as a pattern”.  As luck would have it, the dictionary has used the following example: “The software includes templates for common marketing documents like pamphlets and flyers”.  If you’re reading this article, then most likely you are interested in how the RCA software can provide templates or standards for RCA analysis. In general, I am a big fan of templates; I’ve actually designed some to speed up data entry, or to allow me to quickly identify standard methodologies and information that may be missing.  Templates are great tools. But as with all tools, the old phrase applies: If all I have is a hammer – everything looks like a nail.  In our context, what I’m concerned about is that – if all I have is RCA - every problem will fit the template! Unfortunately not every problem fits neatly into a template.  Just as everything is not a nail.

For large industries this would be fantastic – if someone broke their arm we could fill in a few fields and print out a cause and effect chart of the incident!  If this were the case, then it would follow that most broken arms would fit a template - and that we could prevent several of the causes and again fix all or most broken arms.  As you already know, this won’t work very well, considering there are thousands of ways to break your arm and many different causes that would need be identified.

Perhaps we aren’t looking for such a prescriptive methodology but just something to help speed things up?  Or maybe to give a sense of confidence in what we are doing.

In the scheme of true cause and effect, it is very difficult to make templates for large chunks of an event. 

Consider the small example in Figure 1. 

Figure 1

root cause analysis template

I’ve used “action taken” as a starting point because it could be many things, such as measurement taken, preventative maintenance performed, incision made, etc.  This template works well if a procedure exists, as the only two options are: the procedure was followed or not followed.  If a procedure exists and it was followed, then the template would indicate that you could use the causes shown.  However, given the same starting point, what if the procedure is not followed? 

In figure 2, I’ve shown some possible causes of a procedure not followed.  However those are already dependent on “the true cause”.  Couldn’t the causes just as easily be “procedure known” and “employee decision”?  Or “procedure unknown” and “employee not trained”?  Or other causes that you may be able to come up with.  

Figure 2

root cause analysis template


So does this mean root cause analysis templates don’t apply?  Not necessarily. As you can see from the examples above, you could consider a template where procedures exist or don’t exist, and are followed or not followed, as a form of template for certain items that make sense to use. In cause and effect analysis, these templates are referred to as Causal Elements which will start to show up as you do more and more analysis.  

Some examples where templates might work include:

  • An action of some kind may be the result of ‘procedure exists’ (or doesn’t exist) and ‘followed’ or ‘not followed’
  • Something broken would have to have contact with sufficient force to cause the breakage
  • Something out of specification is caused by the specification value and the actual value
  • A contact is caused by something moving and something else in the path
  • A fall is caused by an action that initiates the fall, gravity, height, and the object that falls
  • Any fire is caused by an act that triggers combustion, combustible material, oxygen, and an ignition source
  • A quality excursion is caused by the ‘part in error existing’ and ‘missed inspection’ (missed inspection can be due to ‘sampling error’ or ‘not inspected as planned’)
  • Personal decision is the result of the ability to act, a reason to act, and absence of consequences of the act

In the above examples, using a template could work because the logic never changes, only the variables.

In summary

In the majority of cases, due to the sheer number of causes to any given problem, using a one-size-fits-all root cause analysis template is just unrealistic. However, in respect to cause and effect analysis, templates may play a role in some cases. This is when the logic is consistent and causal elements can emerge over time and be added to develop robust charts.

New Call-to-Action

Topics: root cause analysis template, rca template, root cause analysis standard template