FEATURED BLOG

3 Simple RCA Facilitation Tips

Posted by Melanie Bennett on Thu, Nov 28, 2013 @ 08:11 AM

By Ned Callahan

“How long should an RCA take?”

This question is similar to how long is a piece of string?

I have heard one manager in a plant that hasproblem analysis stipulated a maximum of two hours for an RCA to be conducted in his organisation. Another expects at least “brainstormed” solutions before the conclusion of day one – within 6 or 7 hours.  It is not uncommon for a draft report to be required within 48 hours of the RCA.

The following three tips may assist to meet tight deadlines and when time expectations are short. One advantage of the Apollo Root Cause Analysis method is that it is a fast process but the “driver” has to be on the ball to achieve the desired outcomes – effective solutions.


  1. YOU DEFINE THE PROBLEM

Imagine the RCA has been triggered by an unplanned incident or event which falls into any of the safety, environment, production, quality, equipment failure or similar categories. You have been appointed as the facilitator by a superior/manager who is responding to the particular event. Your superior/manager may understand the trigger mechanism and may well nominate the problem title.

For example, “upper arm laceration”, “ammonia spill”, “production delay” and so forth could be the offering you make to the team as the starting point for the analysis. Typically, as facilitator you will have gathered some of the “facts” from first responder reports, interviews, data sheets, photographs and so on.  So a good first step is to draft a problem definition statement, including the significance reflected by the consequences or impacts. The team then has a starting point to commence the analysis, albeit the problem statement may change as more detail is provided.

Ideally, you will have already created a file in RealityCharting™ and the Problem Definition table can be projected onto a screen or even onto the clear wall where your charting will be done with the Post-It™ notes. The team members’ information ought to have been entered and can be confirmed quickly in this display. You might even show the Incident Report format and focus on the disclaimer option you have selected deliberately: Purpose: To prevent recurrence, not place blame.

This preparatory work could save at least 20 minutes of the team members’ time and enable an immediate launch into the analysis phase.

NB
Save yourself hours of re-work and potential embarrassment by saving the file as soon as this first process is complete, if you haven’t already done so, and thereafter on a regular basis. Maintain some form of version control so that the evolution of the chart in the following day/s can be tracked if necessary.

If you are particularly well-resourced the chart development might be recorded on the software simultaneously as the hard copy is created on the wall space. A small team might choose to create the chart directly via the software and a decent projection medium.


2.    DIRECT THE ANALYSIS

It is critical that your initiative in preparing the problem definition is not considered by the team members as disenfranchising them. The analysis step whereby all have an opportunity to contribute should ensure that they feel they have “ownership” of the problem.

To reinforce this, it is advisable to choose a sequence of addressing each member, typically from left to right or vice-versa depending on the seating arrangements. This establishes the requirement that one person is speaking at a time, secondly, that each and every statement will be documented and thirdly, that every person has equal opportunity. Your prompt and verbatim recording of each piece of information will provide the discipline required to minimise idle chatter which can waste time because it distracts focus. When you have a series of “pass” comments from team members because the process has exhausted their immediate knowledge of events, launch the chart creation. 

It is worthwhile reminding the team that each information item that has been recorded and posted in the parking area, may not appear in their original form on the chart or at all, in some cases. Because the information gathering is a widespread net to capture as much knowledge regarding what happened, when and why, there will be no particular focus. But because they are coming from people with experience and expertise or initimate knowledge of events and
circumstances, they have some value. The precise value will be determined by where the information sits in the cause and effect logic that starts at the problem and is connected by “caused by” relationships. 

NB. Cause text should be written in CAPITAL LETTERS. It will be easier to read/decipher for the team at the time and perhaps from photographs of the chart later. Similarly using caps in the software itself means that projection of the chart is more effective and the printing of various views is enhanced.


3.    THE “HOW AND IF”  OF  CREATING A REALITYCHART™

Many proponents tap the existing understanding of the event by capturing as many of the action causes as possible. These may arrive via a 5 WHYS process, for example, which starts at the Primary Effect.

            Plant Stopped (Problem or Primary Effect)

            Why? Feed pump not pumping

            Why? Broken Coupling

            Why? Motor Bearing Seized

            Why? Bearing race Collapsed

            Why? Fatigue

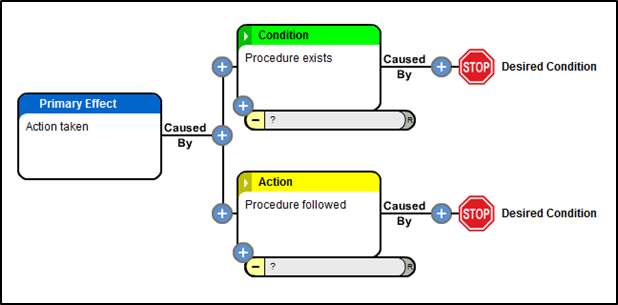
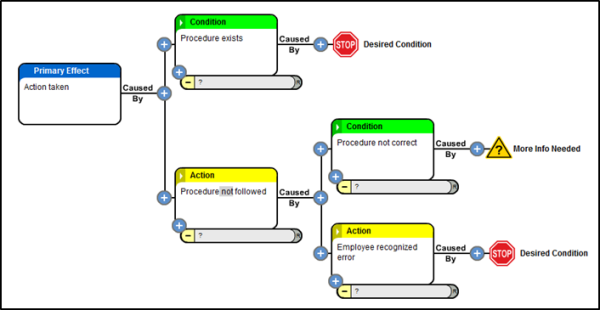
The Apollo Root Cause Analysis methodology requires use of the expression “caused by?” to connect cause and effect relationships. Understanding that there must be at least one action and one condition helps  reveal the “hidden” causes and especially the condition causes which do not come to mind initially.

To support this expression and the essential “why”, consider asking “how”. This may be  employed initially by the most impartial member of your team who has been engaged specifically because of his/her lack of association with the problem and can sincerely ask the
supposedly “dumb” questions. Invariably these questions generate more causes or a more precise arrangement of the existing causes. A “How does that happen exactly?” question can drive the team to take the requisite “baby steps”.  This also often exposes differences between “experts” and the resolution of these differences is always illuminating.

The facilitator needs to be aware of the need to softly “challenge” the team’s understanding while ensuring the application of sufficient rigour to generate the best representation of causal relationships. This can be done in a neutral manner by using the “IF” proposition.

Given that every effect requires at least two causes, you can then address the team with the proposition: “If ‘one exists’ and ‘three exists’ (two conditions) then with ‘four added’ (the action) will the effect be “eight” every time?”. Using this technique on each causal element will generate the clarity and certainty being sought to understand the causes of the problem. If every “equation” (causal element) in the chart is “real” and the causes themselves are “real”
(substantiated by evidence) then the team is well-placed to consider the types of controls it could implement to prevent recurrence of the problem.

The more causes which are revealed the more opportunities the team has to identify possible solutions.


SUMMARY

To speed up the RCA process,

Step 1 Facilitator gathers event information and fills out Problem Definition Statement.

Step 2 Facilitator directs the Information gathering casting a wide net and systematically requests information from participants.

Step 3 Use information gathered to build a RealityChart™ with actions based on what happened then looking for other causes such as conditions which may initially be hidden. Use how and If to help validate that causal relationships are logical.

With a completed chart the solution finding step can begin.


RCA DISCUSSION

What are your thoughts on conducting an RCA facilitation and how much time have you spent preparing the analysis?  Do you have a successful tip worth sharing or discussing? We look forward to reading your feedback and perspective via comments below or let’s connect on our LinkedIn Group – ARMS Reliability - Apollo Root Cause Analysis for further discussion.

training footer ad resized 600


Topics: root cause analysis, rca facilitator, rca facilitation, root cause investigation, root cause facilitation, rca facilitators, 5 Whys

Free eBook: 5 Critical Components in your RCA Program

Posted by Melanie Bennett on Thu, Nov 07, 2013 @ 08:11 AM

5 critical compnents ebook

Incident Investigation is an improvement process. It's about continually working on your weaknesses to realize marginal gains - a number of small improvements that result in a better program overall. 


This eBook breaks down the 5 critical components you should consider when establishing your RCA program – or just as important, when striving to improve your RCA program. You’ll also get practical tips and tactics to get the most value out of each element of your program.


Get My Copy

2 Simple Methods to Improve Your RCA Charts

Posted by Susan Rantall on Sat, Oct 26, 2013 @ 03:10 AM

By Jack Jager and Michael Drew

root cause analysisThe RealityChart™ (cause-and-effect chart) that you generate during a Root Cause Analysis investigation is important as it creates a common understanding of why the problem has occurred.

Creating your RealityChart™ starts with finding the causes that contributed, or played a part, in the event or problem that occurred. During this phase of the analysis, the chart serves as the interactive platform where all of the information is captured, recorded, and organized. The chart should be highly visible so that all group members can see and comment on it.

(Tip: If you build your initial chart using “Post-It®” notes, attaching them to a vertical surface is best. Use dark coloured, thick marker pen for writing. This simply makes the information more readable. If you want to move your chart, post the notes on a roll of brown paper which can be rolled up and moved. Using RealityCharting™ allows the chart to be shared electronically)

The second challenge in the creation of the RealityChart™ is to arrange the causes in a meaningful, logical way that other people can follow and understand. The crucial point here is whether other people can understand the chart, not just you. This is the real litmus test for the chart and can be a challenge. Whilst you may believe that your chart is sound, if other people can’t follow it then it might possibly be subjected to scrutiny, be dissected at every turn, and perhaps even be dismissed if believed to be an inaccurate representation of the problem. Be prepared as others view your chart to listen to what they think, you may discover alternative paths or additional causes that you or the team could not see.

So, to ensure your chart is a good representation of the problem analysis, challenge your charts and be open to other views.

How do you do that?
I’m going to tell you about two ways – Testing your logic and applying “rules check”.

1) Test your logic

Remember there are three important things about charts – Logic, Logic, and Logic! If the logic is sound then the connection should be logical in both directions. What I mean is, if A is caused by B and C, then the converse of this must also be true - B and C cause A.

If you use this test and the statement doesn’t ring true then the connection needs to be changed so that it becomes logical.

Here’s an example.

How often have you heard that you have a “failed bearing” and that this is caused by a “lack of lubrication”? Now whilst this may be true, and it does have the semblance of a logical connection, there is much that happens in between these two causes.

How does it sound when you state the connection the opposite way: Whenever you have a lack of lubrication, you will have a failed bearing. Now this just doesn’t sound right. It is not always true. This understanding indicates that there are other causes that have yet to be found.

What happened to the causes of “metal to metal contact”, “generation of heat”, “expansion of metal”, “narrow tolerances”, “bearing in use”, “lack of monitoring”, “no tripping mechanism”, “extreme heat”, severe duty and so on? There is a lot more information here than meets the eye.

A lack of lubrication itself does not cause the bearing to fail - not instantaneously. A lot of things happen before you have catastrophic failure of the bearing. So the initial statement that you have a “failed bearing” being caused by a “lack of lubrication” is far too simplistic. It is a generalisation that requires a lot of assumptions to be made.

Your job is to present the facts in a logical arrangement rather than allowing or forcing people to make guesses based on insufficient information. The adding of more specific details (even what some people consider to be superfluous detail) can be very beneficial in facilitating this. It is the detail that allows comprehensive understanding of your chart.

2) Apply the “Rules Check”

When using the Apollo Root Cause Analysis methodology, your RealityChart™ must have:

Evidence to support each of the causes.
This validates the information which gives the chart credibility.

Stop points indicated and a reason for stopping also provided.
This indicates to everyone that you have stopped asking questions on that causal path and have provided a valid reason for doing so. When all cause paths have been completed in this manner, then the chart is finished.

Causes should be labelled as either actions or conditions.
This helps you to see what type of causes you have found and therefore what may have been missed. It drives the questioning process to another level.

Each connection should have a least one action and also one condition.
Though typically we see more conditions than actions, we should never see a straight line of causes within a chart. This too should generate the asking of more questions.

Any anomalies or violations to these “rules” should demand that another question be asked. The anomaly, or violation, must be challenged.

It is the challenge that is important. Challenging the cause and effect charts consistently will improve the quality of the charts. It is about dotting the “I”s and crossing the “T”s. That said, there is no such thing as a correct chart – they are always a work in progress. They are rarely if ever “perfect”.

The initial chart should be considered a draft and is a direct reflection of the information you have available and the amount of time that you have to organize and challenge it. As the chart continues to develop, challenge it constantly using the logic test and the rules check.

Significantly, a quality chart will enable you to demonstrate the effect that your corrective actions will have on the problem or event. If you eliminate or control a cause that forms part of a causal relationship, then whatever happens after that point is effectively prevented from occurring and you can demonstrate this very effectively by referring to a detailed, logical chart.

Added benefits:

  • Once a quality chart has been produced for a systemic, recurring failure, that chart could be used as a template and rolled out when similar failures occur. Then, it’s a matter of challenging the chart to see if the information is all correct.

    How much time would this save your organization in investigations? How much time would it save your organization to solve systemic issues that are eliminated?

  • A “quality” chart can be a learning tool. It can be shared amongst colleagues as a resource that shows what to look for when similar problems arise.

Summary

A RealityChart™ is a dynamic view of the logical cause and effect relationships that represents the logic as to why a problem has occurred. They can be shared, challenged and changed over time. They lead to effective solutions for one off and systemic problems.

Demand excellence in your charts. The effort in trying to achieve this will be time well spent.

5 Ways to Maximize a Training Budget

Posted by Melanie Bennett on Wed, Oct 16, 2013 @ 09:10 AM

By Ned Callahan

1. Identify training which will attract maximum participation for maximum benefit.

The one single thing which affects everybody is change, planned or unplanned.

In the realm of Continuous Improvement, which is about implementing planned changes for efficiency, safety, quantity or quality benefits, the capacity to adapt to change is particularly valuable.2013_Apollo_Ned2.jpg

Even planned changes can cause problems which have not been anticipated. Sometimes execution is imperfect. Risk assessment is a particular discipline which aims to identify then minimise possible negative consequences. Expressing these possible negative scenarios as potential problems is a starting point for assessment and the identification of possible controls.

But it is the unplanned changes which are the greatest cost to business. The most adaptable personnel are typically the best learners and effective learning requires acknowledging the past. The adage that “learning from history means not repeating the mistakes of the past…” is often quoted.

In a commercial or industrial sense, past events, past failures, past incidents need to be mined thoroughly to derive the benefits of the experience if they are to be avoided in the future; hence    the “lessons learned” expression is widely applied in business analysis nowadays. 

There is little doubt that everybody can benefit from the ability to thoroughly and methodically analyse those “mistakes” therefore a targeted problem-solving course ought to be a priority.


2. Provide short, practical courses which challenge conventional thinking.

Any training course exceeding three days is going to test the endurance, not to mention the enthusiasm, of participants. Individuals learn at their own pace and need to feel challenged in order to maintain their concentration and to realise the potential benefits of the course content. One day is barely enough in many cases, two allows for the new learning to settle overnight - the learner will have “absorbed” some key concepts (new neural paths created) and have developed a more critical approach.  The third day, if structured appropriately, or even customised to suit the specific needs of the student/client, will ensure that the expected benefits are actually produced in the classroom.

The course itself needs to have sufficient clout – in other words, its impact will far outweigh the “time lost” attitude that often prevails. The students have their other work to do still.

Finding a course that makes them more efficient at solving their current problems would be most appropriate.


3. Utilize a course which encourages cross-discipline co-operation via collaborative exercises.

Most training courses are directed at specialists in particular fields with rich content and “sophisticated” methods. Typically, there is a modicum of small team exercises complementing a lecture type presentation and a plenary session for answers and questions. 

Consider a course which benefits the students precisely because they do have different
professional skills, experience and ways of thinking about the world around them. Staged exercises of varying length ensure the students have the opportunity to challenge one another continually in an open, respectful manner while focused on an agreed problem for analysis. The egos and preponderance of “rules” required by the method which makes so much problem-solving activity inefficient, stressful and ultimately unproductive can be neutralised.  


4. Require continuing support via web-based resources and specialist advice.

The era of e-learning is well-advanced and having access to a website containing substantial  pertinent printable material, multiple video clips as well as interactive simulation exercises to reinforce the student’s understanding is  most valuable. All the better if this is provided gratis after the completion of the course.

Furthermore, the trainer will be available for individual facilitation sessions at the organisation, will gladly take back-up calls post-training and will be delighted to cast a critical eye over submitted charts should the student require another objective opinion.  This needs to be done in strict confidence.


5. Expect useful software with a perpetual licence.

Software which enables the development of charts, tables and reports in order to concisely communicate the detail of the analysis and its recommendations is almost obligatory.

A digital format of the course may be preferred. This could entail the use of a computer lab or alternatively, students with the licensed, registered copies of the software receive guidance and growing confidence during class exercises. By the conclusion of the course they should be able to produce professional problem reports with effective solutions identified.

Root Cause Analysts Tips & Tricks - 101 Ways to improve your RCA Investigations

Posted by Susan Rantall on Wed, Sep 25, 2013 @ 00:09 AM


Our latest eBook gives you access to all our top tips for conducting better root cause analysis investigations.

101 Root Cause Analysis Tips

We've covered root cause analysis from start to finish:

  • Gathering information

  • Assembling the team

  • Conducting the RCA

  • Implementing the solutions

  • Measuring the success of the corrective actions

  • Advertising your successes

  • Plus, a whole section of tips for the RCA facilitator

Get My Copy

Topics: root cause analysis, rca skills, rca facilitation, root cause investigation, critical rca skills, root cause analysis tips

Creating a Common Reality in Root Cause Analysis

Posted by Melanie Bennett on Thu, Sep 19, 2013 @ 14:09 PM

By Kevin Stewart

Over the years of using the Apollo Root Cause Analysis methodology in the field, I’ve achieved a “normalization of deviance” when it comes to generating a common reality.  In general, it means that I don’t always think about it or discuss it much because it is just the way things are and have been for me.  So I thought I would reflect on this to remind myself how powerful a tool the Apollo Root Cause Analysis methodology is.

URubik Cube   Common Reality RCAnfortunately I can’t speak for other processes since the company I worked for standardized on the Apollo Root Cause Analysis methodology early on.  Since it worked for us we decided to spend our time using it instead of looking for the best process.  (I would be interested in others’ comments about generating a common reality utilizing other processes.)  So, my comments are from a single perspective but to use an old phrase – don’t tell me it can’t work – when others are doing it!  Hopefully other processes have equal success in this important aspect of RCA work.

In my corporate life we used to always be concerned with people who would nod their head yes to your face but internally were thinking – “it isn’t going to happen buddy”.  Many times this was associated with the first line supervision since they had the direct contact with the work force and could make or break any initiative regardless of whether it came from the highest levels or not.  It was very clear to me that if they saw the “WIIFM” (What’s in it for me), and agreed with it, that they could also be the biggest ally. 

After many tough lessons and some personal experience, this fact became painfully obvious to me - If the supervisor recognized the value to him by believing that something would actually solve a problem that caused him pain and anguish, he was more likely to support it and even take the lead in implementing the solution.  So how do we make this happen?

Most of us have heard the saying that “You support what you help to create”.  Well, the Apollo Root Cause Analysis methodology helps insure this happens by creating a common reality where everyone who participates in the team truly understands:

  • The value of the problem
  • What the solutions are

And more importantly –

  • How they will affect the problem

If they can see the causal connections and understand them, it is not a big stretch to see why chosen solutions will actually fix a particular problem, or “Primary Effect”, as we like to call it.

I have participated and facilitated in many RCA’s and have yet to leave one where everyone isn’t on board. I don’t think about this much, but that is the normalization of deviance. 

Why does it work?

My thoughts are that if you come out with an initiative and tell everyone that they will do it.  They have little choice in many cases, but they can dig in their heels and wait out the management change – then they don’t have to do it.  Why is this? 

My opinion is that everyone can either see or know that the initiative won’t fix the problem, or won’t work, or has been tried before, etc.  So why bother. 

I myself remember saying “How could that possibly solve the problem!?”  Or if it was some off-the-cuff initiative – perhaps my thoughts were “What problem are they trying to fix?”.  In either case, I saw no value in pursuing the initiative or helping since the work I was doing was helping to make my life or my corporation’s life easier or more efficient (and besides I can always wait out the 3-4 year management exchange period and not have to deal with it). 

The problem here is that they didn’t ask me what I thought, or they didn’t make the connection for me by telling me “WIIFM”.  Now if I had been part of the team, or could see the connection, that would be a horse of a different color.  This is why I believe the Apollo Root Cause Analysis methodology is so good at generating a common reality. People responsible for the solutions are usually part of the team, and if they are not, they can look at the chart and see the causal paths and everyone inherently knows that if you block off a street a car can’t go down that path (in other words, eliminate a cause path and the effect won’t happen).

So when you complete the analysis and ask around, everyone is in agreement because they all have participated, their input is on the chart, and they understand the flow and can speak about it. They also understand why implementing their solutions will be effective.  This, in a nutshell, is the common reality we need to insure the team is all rowing in the same direction.

training footer ad resized 600


How to combat mediocrity in your RCAs

Posted by Melanie Bennett on Thu, Sep 12, 2013 @ 08:09 AM

By Jack Jager

We are all problem solvers. Each and every one of us actively deals with problems on a regular, if not a daily basis. However, the crucial question is “Is everyone actually good at problem solving?”

Quality of investigations vary and the trend appears to be a practical application of the normal curve. There are some fantastic results from investigations and also some poor results. But, if your organisation is seeing  a whole pile of average investigations and average reports that result from them, then the effectiveness of your Investigation program can be improved.

Mediocrity occurs for a number of reasons. This article focuses on four aspects of your RCA program which, if not set up correctly, could be catalysts behind a consistent flow of mediocre root cause analysis investigations within your organization.

Mediocrity Sign Blog1)     A structure to support training

So, you’ve trained your employees in root cause analysis and you’re expecting to see some fantastic RCA results coming through. Right?

…Not so fast.

If there is little structure to support the training in terms of:

  • a requirement to use the process,
  • mentoring and feedback provided to trainees,
  • or quality audits on their efforts,

Then you can expect to see a whole range in terms of the quality of investigations being submitted. If the majority of the investigations are average then the value of the training comes into question.

This has often been the stimulus to look for different training in an alternative methodology because the perception is that the process selected for use by the company is not meeting expectations, it’s not working, people are not using it, and people don’t like it, or it’s not getting the results…..and so on.

If any training is unsupported, the same outcome could occur. So is this a problem with the training or a problem with the structure that supports the training?

Two days of training or a week of training doesn’t make anyone an expert in anything. Each trainee sits somewhere along the learning curve at the start of the training and hopefully, if they have been paying attention, they move along the curve to a better place after the training. The purpose of the training is to skew the curve – to move the curve to the right so you have more investigations being completed to a higher standard.

The challenge for all companies is to work out how to move trainees from where each
individual sits on that learning curve after the training, to application of excellence within the discipline at which the training was directed.  Isn’t this what was originally intended?

For many individuals, this transition along the learning curve lacks clear structure and in many cases this structure simply does not exist. We train our people and then, figuratively speaking, throw them to the wolves expecting them to be the evangelists for the learning and the cure to all of our problems.

So what happens when we then get an average outcome? We don’t see the value in training more staff. And in this instance of problem solving, we will see a greater acceptance of mediocrity and of our inability to change this. It is essential that there is a feedback loop, whereby mediocre investigation reports are not accepted, or signed off.

Underpinning an effective investigation program requires managerial overview, whereby
managers are skilled in the RCA methodology and can challenge the outcome, provide positive recognition or insist on rework. If managers are not trained in the RCA method, then they are in the hands of the people who have been trained, and the danger is that mediocrity becomes the norm.

2)     Amount of time dedicated to investigations

How long does an investigation take? Should it be one hour?  Four hours? One day? One week?

There is no right answer.

If an investigation is warranted then it should be resourced to a point where an excellent result is possible. If that means you have 5 people in a room all day then so be it. The significance of the problem must warrant that level of support.  

Conducting a root cause analysis requires a dedication of time and resources to achieve a
desirable outcome. How much do your problems cost you after all? If you want your investigations to be effective, then you will need to support them to the level needed. A clear understanding of the organisation’s threshold limits that determine the level of response, is essential to ensure appropriate allocation of resources and time to attend or complete an investigation.

When you find yourself in a rush, ask yourself if you are simply satisfying the need to report, completing obligatory requirements, just meeting deadlines or is there a genuine opportunity to improve the business and make a difference.

3)     Involving the “right” people

If you don’t have the “right” people in the room – those with intimate knowledge or experience with the problem, then how good will the investigation will be?

Information is a key ingredient in all investigations and successful investigations require
that you have that information in the room in the form of the people who have the knowledge, data, evidence and reports.

Positive support and approval from management are necessary for people to be given the
time to attend the investigation.

4)     Having the “right” facilitator

Do you have the “right” person facilitating?

Good communication skills are important, both verbal and non-verbal. A willingness to be the facilitator should also be considered…someone who has the desire to do this job.

A good facilitator should be impartial, unbiased, willing to ask the dumb question, and arguably should not be the subject matter expert. A great facilitator recognises that the credit for a good investigation outcome belongs to the team, and he works deliberately to facilitate that outcome.

In summary

The cost of significant incidents has a direct impact on the bottom line. Incidents can cost a company hundreds-of-thousands or even multi-million dollars. Every incident or accident that occurs is an opportunity to learn. If we can learn effectively by doing a high quality RCA, then the goal of trying to prevent their reoccurrence is far more likely to be achieved.

The best results occur from investigations that are well supported, have the right facilitator, and have the right people involved who have been given sufficient time to understand the event so they can present the best report possible.

Getting these elements right will go a long way towards moving the quality of your RCA investigations away from mediocrity and towards excellence.

A key factor in establishing the framework for an effective RCA program is a common application standard, and easy to use reporting, and charting tools. The Apollo Root Cause Analysis methodology has been used for over 20 years to support effective Problem Solving. RealityCharting™ software has been developed to provide standardisation, as well as quality checks and help. RC Coach is an online support tool with easy to access refresher training to help individuals to keep learning beyond the classroom.


describe the image

Topics: rca skills, root cause analysis skills, critical rca skills

Does your Continuous Improvement Model have Problem Solving at its core?

Posted by Susan Rantall on Thu, Aug 01, 2013 @ 07:08 AM

By Kevin Stewart

continuous improvement model
Continuous improvement is basically getting better than you were in the past.  So, how is something better than it was in the past?

In my mind it is associated with more, better, and faster.  In other words: I make more products with the same work, or I get a better quality product with the same work, or I can work faster with the same effort and therefore make more products and reduce my unit cost. 

In each case there may be a barrier, bottleneck, or something preventing you from making the improvement. While Root Cause Analysis is not always the right tool to resolve that barrier or bottleneck, it should be a foundation tool in the process of continuous improvement.  

I believe that a facility’s or a person’s continual success is directly dependent on their ability to solve problems.  

In Ron Moore’s book entitled “Making Common Sense Common Practice” he discusses three companies - an “A” company, a “B” company, and a “C” company. In his description, “A” company is the best of the best and “C” company is the one always lagging toward the back of the pack - making money in good times and struggling or failing in the tough times. Company “B” is in the middle of the pack.

Here’s a quote from his book:

“The difference between the best companies and the mediocre/ poor [companies] in this model is the emphasis the best companies give to the denominator (unit cost = cost/capacity).  That is, they focus on maximizing the capacity available through applying best practices and assuring reliability in design, operations and maintenance, and through debottlenecking.  They then use that capacity to go after additional market share, with little or no capital investment.  Note that in doing this, they also minimize the defects which result in failures and additional costs.”

The sentence in bold above is essentially saying that they aggressively follow a continuous improvement model of some kind to achieve that focus.

There are many tools available to a practitioner who is focused on continuous improvement. However, in my experience coming from an industrial environment, effective problem solving has one of the highest returns for the dollars and time spent of any of the tools.

This is not to say that the other tools mentioned in Ron’s book are not valuable – in fact I spent a large portion of my career attempting to establish and institutionalize those tools and processes. But every time something doesn’t meet expectations, or your downtime is greater than expected, or a piece of equipment can’t provide the uptime you need, that is the definition of a problem that needs resolution.

Also, in my career I discovered that many of the continuous improvement tools would not work well unless some of the more blatant and repetitive problems were resolved first. The most visible of these is planning and scheduling. Trying to plan and schedule in a reactive environment is next to impossible because every time you try to schedule a job, it gets usurped by a failure somewhere. This is frustrating for everyone and leads to an uphill battle.

So I believe that if you look deep inside an “A” company you will find a continuous improvement model that supports problem solving at its core.

Many people would say that Toyota is such a company; and they have many tools at its disposal - one of them being the 5 Whys. This is simply a problem solving methodology that allows operators and others to fix problems at the appropriate level, thereby supporting their continuous improvement model. The 5 Whys problem solving tool was developed to support Toyota’s original foundation premise of “Eliminate Waste” which is basically what Ron Says the “A” companies are doing. They are solving problems by identifying causes for the waste and then putting in place solutions to eliminate it.

If you think about the automotive industry as an example, are they driven by continuous improvement due to competition?

Do you remember when you had to replace or set the points in a distributor on a regular basis?  

Nowadays, through continuous improvement, there is no wear and electronic ignition has all but eliminated the need for that task…thereby eliminating waste and putting the original auto manufacturers ahead. The others had to follow suit in order to not lose market share or reputation.

The same thing happened with spark plugs. I haven’t change a set in quite a while since they started lasting 100,000 miles. You could make the case that it has cost companies money since they don’t sell parts anymore, however, I think anyone that didn’t move with these new technologies would have been left in the dust and lost market share.

As illustrated in the above examples, the best of the best are driven by continuous improvement to stay ahead of the game or to catch up quickly – no matter what the industry. This status is achieved through a combination of tools and problem solving techniques, with cause and effect being one that, in my opinion, should be at the core of your continuous improvement model.


Webinar Elements to Sustain a RCA Program


Root Cause Analysis Template: Can one size really fit all?

Posted by Susan Rantall on Fri, Jul 19, 2013 @ 06:07 AM

By Kevin Stewart

root cause analysis template

Wouldn’t it be great if problems presented themselves in a manner that would allow
them to perfectly fit a standard root cause analysis (RCA) template or process so that we could just plug in a few details and say “Voilà, here is the answer”?
 

Or even if they were close enough for us to adapt a standard template to allow us to quickly modify a standard analysis and come up with a reasonable standard answer? Life would be great!

If we look up “template” in the dictionary we get: “something that establishes or serves as a pattern”.  As luck would have it, the dictionary has used the following example: “The software includes templates for common marketing documents like pamphlets and flyers”.  If you’re reading this article, then most likely you are interested in how the RCA software can provide templates or standards for RCA analysis. In general, I am a big fan of templates; I’ve actually designed some to speed up data entry, or to allow me to quickly identify standard methodologies and information that may be missing.  Templates are great tools. But as with all tools, the old phrase applies: If all I have is a hammer – everything looks like a nail.  In our context, what I’m concerned about is that – if all I have is RCA - every problem will fit the template! Unfortunately not every problem fits neatly into a template.  Just as everything is not a nail.

For large industries this would be fantastic – if someone broke their arm we could fill in a few fields and print out a cause and effect chart of the incident!  If this were the case, then it would follow that most broken arms would fit a template - and that we could prevent several of the causes and again fix all or most broken arms.  As you already know, this won’t work very well, considering there are thousands of ways to break your arm and many different causes that would need be identified.

Perhaps we aren’t looking for such a prescriptive methodology but just something to help speed things up?  Or maybe to give a sense of confidence in what we are doing.

In the scheme of true cause and effect, it is very difficult to make templates for large chunks of an event. 

Consider the small example in Figure 1. 

Figure 1

root cause analysis template

I’ve used “action taken” as a starting point because it could be many things, such as measurement taken, preventative maintenance performed, incision made, etc.  This template works well if a procedure exists, as the only two options are: the procedure was followed or not followed.  If a procedure exists and it was followed, then the template would indicate that you could use the causes shown.  However, given the same starting point, what if the procedure is not followed? 

In figure 2, I’ve shown some possible causes of a procedure not followed.  However those are already dependent on “the true cause”.  Couldn’t the causes just as easily be “procedure known” and “employee decision”?  Or “procedure unknown” and “employee not trained”?  Or other causes that you may be able to come up with.  

Figure 2

root cause analysis template


So does this mean root cause analysis templates don’t apply?  Not necessarily. As you can see from the examples above, you could consider a template where procedures exist or don’t exist, and are followed or not followed, as a form of template for certain items that make sense to use. In cause and effect analysis, these templates are referred to as Causal Elements which will start to show up as you do more and more analysis.  

Some examples where templates might work include:

  • An action of some kind may be the result of ‘procedure exists’ (or doesn’t exist) and ‘followed’ or ‘not followed’
  • Something broken would have to have contact with sufficient force to cause the breakage
  • Something out of specification is caused by the specification value and the actual value
  • A contact is caused by something moving and something else in the path
  • A fall is caused by an action that initiates the fall, gravity, height, and the object that falls
  • Any fire is caused by an act that triggers combustion, combustible material, oxygen, and an ignition source
  • A quality excursion is caused by the ‘part in error existing’ and ‘missed inspection’ (missed inspection can be due to ‘sampling error’ or ‘not inspected as planned’)
  • Personal decision is the result of the ability to act, a reason to act, and absence of consequences of the act

In the above examples, using a template could work because the logic never changes, only the variables.

In summary

In the majority of cases, due to the sheer number of causes to any given problem, using a one-size-fits-all root cause analysis template is just unrealistic. However, in respect to cause and effect analysis, templates may play a role in some cases. This is when the logic is consistent and causal elements can emerge over time and be added to develop robust charts.

New Call-to-Action

Topics: root cause analysis template, rca template, root cause analysis standard template

What is the Value in Identifying Root Cause?

Posted by Jessica Peel on Tue, Jul 09, 2013 @ 10:07 AM


By Jack Jager

Understanding the root cause of a problem is the purpose of many or all investigations. However, the concept of “root cause” suggests that there is only one, singular cause that is at the “root” of any problem.


Searching for Root Cause

The root cause concept and how it is applied often leads to this perception of a singular cause. For example, the statement “What is the root cause of the problem?”

So what is “root cause” and how is it defined? It can be difficult to find a clear and precise definition. The following  well-defined description reveals something very simplistic;  “Root Cause can be described as that cause, which if it were controlled or eliminated would make the problem go away. Therefore it may be considered a root cause”.

This is an interesting concept as it can be applied to a number of causes within a cause and effect chart, therefore, it can be said that there are many “root causes”.

Cause and Effect analysis and Reality charting indicates that a problem doesn’t occur from a single cause, but for any problem there can be many cause and effect relationships that can trigger a problem. Therefore how do we know which of these causes is the root cause?

If you were to ask this question to various people, there may be a number of different answers.  One person may think the root cause is one thing, while another would consider the root cause to be something else. Each party may in fact be right. So how can a “root cause” be assigned unless we are certain that a solution will prevent the problem from recurring?

Let’s look at the example below:

What are the causes of a fire? For a fire to occur there must be certain conditions present. Each of these conditions are a contributing cause of the fire.

  • There must be oxygen present (a conditional cause)
  • Fuel to burn (a conditional cause)
  • An ignition source, such as a match or lighter (also a conditional cause)

All of these causes can exist in harmony with each other and can do so for some time.

It is only when an “action” cause occurs, such as the lighting of a match that the fire will actually occur.

So what is the “root cause” here?

If we apply the definition provided above for “root cause” here, then by eliminating the oxygen, there would be no fire. Therefore “oxygen” is a root cause of the fire.

If you were to remove the combustible material, fuel, then this too will satisfy the definition requirement. The problem would not reoccur. Therefore “fuel” is also the root cause of the fire.

If you were to also remove all of the ignition sources, then there would be no possibility of a fire. This too satisfies the definition requirements. Therefore the “ignition source” is the root cause of the fire.

If no match was to be lit, then there would be no fire. Therefore “the lighting of the match” must be the root cause of the fire as well.

Based on this example, there are potentially four root causes and each of them satisfies the root cause definition. This can be quite confronting in a sense to recognise that there are many potential root causes for a problem. It is, however, liberating too because now you have many potential corrective actions rather than just one.

How often have you heard someone ask “What is the root cause of the problem?” and “you can’t control the problem until you have identified what the root cause is”.

How do we determine which causes to control? In the fire example, who will determine the control or controls to put into place? It’s unlikely that oxygen will be eliminated, as this can be a very costly and difficult process (although we do use this concept in confined spaces).

Can we control the combustible material? If we were to eliminate the fuel then would we have an effective control? This is possible in some cases but not in others.

What about the ignition sources? If there were no lighters or matches present or available, then there would be no fire. Do we have the ability to remove these?

If we could stop the persons action from occurring then we would also have controlled the possibility of a fire happening.

Based on these rationales, which of these controls should be implemented? Is this decision governed by certain criteria? And then the question about what we can control also comes into play.

So what criteria can we use to determine our choices?

  • Money - it needs to be cost effective
  • Safety - it needs to be safe
  • Easy - if possible it should be easy to do
  • Quick - being able to do it quickly has merit
  • Doesn’t cause other problems – at least not unacceptable problems
  • Is an ongoing fix – and is not a band-aid. The solution will fix the problem for today and tomorrow, as well as next week and next year.

and other criteria may also be considered.

The above criteria are taken into consideration when making the decision about which solutions to implement. At the end of the day, it is important to have an understanding of the problem and how many of the causes you need to control to prevent recurrence.

Did the notion or understanding of what the “root cause” is come into consideration when making the decision about which solutions to implement?  No, therefore what is the value of identifying “root cause”?

In my mind, it is the concept of “root cause” that is important. Applying this concept requires us to understand the problem as completely as possible, before we make decisions about corrective actions. If we do this, then we are in the best possible position to make good decisions about which corrective actions to implement. 

The decision of which solutions to implement is a choice. It is a choice we make according to a set of criteria. It is based on the answers you acquire when applying the criteria questions that allow you to be objective in your decision making process to find the best solution.

In Summary

In many ways the concept of “root cause”, whilst being important in the broader application, is often a misnomer when used to describe the critical cause for a unique incident. It is not the only cause. Other causes must also exist.  

At the end of the day it is your choice about which causes you wish to control. Therefore it is important to remain objective in this decision making process, via utilising a set of criteria, and applying them to all possible solutions. Let the answers to the criteria questions determine what the best solutions are, and that will determine what you consider to be the “root cause” of the problem.

training footer ad resized 600


Topics: root cause analysis, rca skills, root cause analysis skills, rca facilitation, root cause investigation, critical rca skills, root cause analysis program, root cause facilitation