FEATURED BLOG

Human Factors: Challenging Traditional Assumptions and Methods That Focus on the Actions of Individuals

Posted by Jessica Peel on Thu, Nov 17, 2016 @ 04:11 AM

Author: David Wilbur, CEO - Vetergy Group

To begin we must draw the distinction between error and failure. Error describes something that is not correct or a mistake; operationally this would be a wrong decision or action. Failure is the lack of success; operationally this is a measureable output where objectives were not met. Failures audit our operational performance, unfortunately quite often with catastrophic consequences; irredeemable financial impact, loss of equipment, irreversible environmental impact or loss of life. Failure occurs when an unrecognized and uninterrupted error becomes an incident that disrupts operations.bigstock-Worker-in-factory-at-CNC-machi-82970306.jpg

Individual Centered Approach

The traditional approach to achieving reliable human performance centers on individuals and the elimination of error and waste. Human error is the basis of study with the belief that in order to prevent failures we must eliminate human error or the potential for it. Systems are designed to create predictability and reliability through skills training, equipment design, automation, supervision and process controls.

The fundamental assumptions are that people are erratic and unpredictable, that highly trained and experienced operators do not make mistakes and that tightly coupled complex systems with prescribed operations will keep performance within acceptable tolerances to eliminate error and create safety and viability.

This approach can only produce a limited return on investment. As a result, many organizations experience a plateau in performance and seek enhanced methods to improve and close gaps in performance.

An Alternative Philosophy

Error is embraced rather than evaded; sources of error are minimized and programs focus on recognition of error in order to disturb the pathway of error to becoming failure. 

Slight exception notwithstanding, we must understand people do not set out to cause failure, rather their desire is to succeed. People are a component of an integrated, multi-dimensional operating framework. In fact, human beings are the spring of resiliency in operations. Operators have an irreplaceable capacity to recognize and correct for error and adapt to changes in operating conditions, design variances and unanticipated circumstances.

In this approach, human error is accepted as ubiquitous and cannot be categorically eliminated through engineering, automation or process controls. Error is embraced as a system product rather than an obstacle; sources of error are minimized and programs focus on recognition of error in order to disturb its pathway to becoming failure. System complexity does not assure safety. While system safety components mitigate risk, as systems become more complex, error becomes obscure and difficult to recognize and manage.

Concentrating on individuals creates a culture of protectionism and blame, which worsens the obscurity of error. A better philosophy distributes accountability for variance and promotes a culture of transparency, problem solving and improvement. Leading this shift can only begin at the organizational level through leadership and example.

The Operational Juncture™

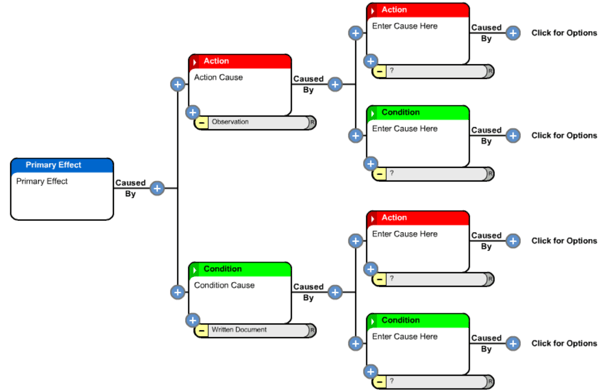
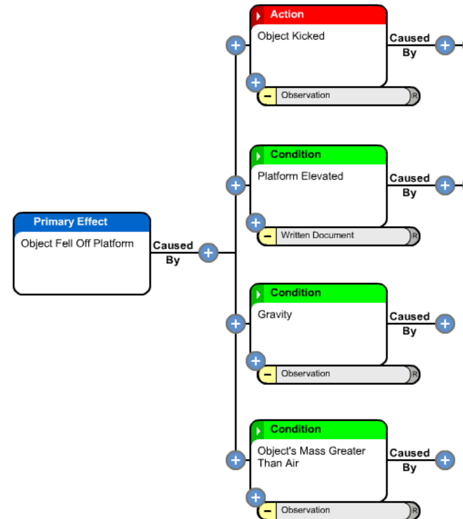
In contrast to the individual-centered view, a better approach to creating Operational Resilience is formed around the smallest unit of Human Factors Analysis called the Operational Juncture™. The Operational Juncture describes the concurrence of people given a task to operate tools and equipment guided by conflicting objectives within an operational setting including physical, technological, and regulatory pressures provided with information where choices are made that lead to outcomes, both desirable and undesirable.

It is within this multidimensional concurrence we can influence the reliability of human performance. Understanding this concurrence directs us away from blaming individuals and towards determining why the system responded the way it did in order to modify the structure. Starting at this juncture, we can preemptively design operational systems and reactively probe causes of failure. We view a holistic assignment of accountability fixing away from merely the actions of individuals towards all of the components that make up the Operational Juncture. This is not a wholesale change in the way safety systems function, but an enhanced viewpoint that captures deeper, more meaningful and more effective ways to generate profitable and safe operations.

A practical approach to analyzing human factors in designing and evaluating performance creates both reliability and resilience. Reliability is achieved by exposing system weaknesses and vulnerabilities that can be corrected to enhance reliability in future and adjacent operations. Resilience emerges when we expose and correct deep organizational philosophy and behaviors.

Resilience is born in the organizational culture where individuals feel supported and regarded. Teams operate with deep ownership of organizational values, recognize and respect the tension between productivity and protection, and seek to make right choices. Communication occurs with trust and transparency. Leadership respects and gives careful attention to insight and observation from all levels of the organization. In this culture, people will self-assess, teams will synergize and cooperate to develop new and creative solutions when unanticipated circumstances arise. Individuals will hold each other accountable.

Safety within Operational Resilience is something an organization does, not something that is created or attained. A successful program will deliver a top-down institutionalization of culture that produces a bottom-up emergence of resilience.

HFWebBanner.jpg

Topics: root cause analysis, corrective actions, incident investigation, accident investigation, human factors

Using Classifications in RCA to Uncover Enterprise-wide Problems and Patterns

Posted by Jessica Peel on Thu, Nov 17, 2016 @ 04:11 AM

These days, many enterprise-level organizations are likely to have similar operations in multiple locations regionally or even worldwide. When a piece of equipment fails or a safety incident occurs at one site, the company investigates the problem and identifies solutions or corrective actions. Naturally, the team wants to capture the lessons learned and share them with other sites that have similar equipment, processes and potential incidents. investigation files.jpg

Advanced tools like the RealityCharting® software enable teams to share results of an Apollo Root Cause Analysis (RCA) across multiple layers of stakeholders. However, a large multinational enterprise might have dozens of different investigations going on at any given time. At the highest levels, decision-makers don’t necessarily want to see granular information about specific causes at any given plant. They need a top-down perspective of problems and patterns that are affecting the entire organization.

At ARMS Reliability, many of our clients have expressed a similar need. Our solution? Using classification tags to create and apply a consistent taxonomy to all root cause analyses performed for a given organization. Rolled up into a composite report, these tags reveal enterprise-wide trends and issues, allowing management to create action plans for tackling these systemic issues. For example, classification tags might uncover a large number of problems related to a lack of preventative maintenance on a certain type of pump, or a systemic non-compliance with a required safety process.

A classification taxonomy can be scalable and configured to an organization's goals and processes. Think of these classifications like buckets that can be applied at any level of the RCA — e.g., to the root causes or solutions, to individual contributing causes, or simply to the RCA investigation in general.

 Keep in mind: The Apollo Root Cause Analysis method is centered around a free-thinking approach to solving problems. That’s what makes the methodology so powerful — it doesn’t lead you down any generic predetermined pathways by asking leading questions or categorizing various causes or effects in any way. At ARMS Reliability, we advocate applying classification tags only after the root cause analysis investigation is completed, so you keep the free-thinking causal analysis and organize it later, for the purpose of rolling the findings up into a deeper systemic view.

Taxonomies can range from 5–20 categories into the hundreds. For example, here we’ve used a human factors taxonomy to tag causes as organizational influences and other people-centric issues.

screenshot 1.png

 (Click to enlarge)

Reports can provide a summary of how many causes were classified under the various tags:

screenshot 2v2.jpg

 (Click to enlarge)

In another example, an organization bases its taxonomy of reliability issues on the ISO 14224 - Collection and exchange of reliability and maintenance data for equipment.


screenshot 3v3.jpg

 (Click to enlarge)

The taxonomy options are endless. Most organizations we work with have their own unique systems of classifications. It’s really all about codifying the types of information your organization most needs to capture.

If adding classifications to your Root Cause Analyses would be useful for your organization, contact ARMS Reliability. We’d be glad to show you more about what we’re doing with other clients and help you develop a taxonomy that works best for your needs.

Topics: root cause analysis, human factors

Actions or Conditions: What is the Difference and Why Does it Matter?

Posted by Jack Jager on Fri, Aug 12, 2016 @ 03:08 AM

One of the four basic principles in the Apollo Root Cause Analysis methodology is that for each effect there are at least two causes and these causes are either actions or conditions. bigstock--133288028_BWCropped.jpg

This principle causes you to think more critically, challenge causal relationships more consistently, and to understand that things are rarely as simple as they may seem.

One implication of this principle is that there should never be a straight line, or even a partial straight line of causes within a cause and effect chart. A straight line tells us that there are other causes that still need to be found or identified, and more questions must be asked.

In each causal connection we should see at least one action cause and one condition cause.

So what are actions and conditions?

Conditions exist—they refer to the current state of things. Take gravity for instance—it is there all the time. Gravity exists. So this cause would be a conditional cause.

Conditions must exist. They always exist alongside of any action.

An action cause is a cause which makes use of the available conditions. If the conditions didn’t exist, then the action would have no effect at all. The action cause is that moment in time when something happens. It is the thing that is different—the instigator or the catalyst of the effect that occurs.

Typically, there is one action and several conditions. Many of the action causes are also related to the things that people do. Action causes are readily seen and tend to be easily identified. When people tell the story of what happened they often list a series of actions, and relatively few conditions.  When we create a timeline or sequence of events, the initial straight line will be constructed mostly of actions. image_1.png

The Apollo Root Cause Analysis methodology demands an exhaustive search for both condition causes and action causes. If you only see half of the problem, will you really understand it? If you only find half of the causes, you will also only have half of the opportunities for controlling or mitigating the problem to an acceptable level.

Let’s take a look at an example – “An Object Fell Off a Platform”

“What happened to make the object fall?” would be a good question to ask. Let’s say someone kicked it off the platform. This is the direct cause of why the object fell, so this is considered an action cause. It is the ‘something’ that happened.  An action cause will typically be described using a noun/verb connection as in ‘object /kicked.’

But it’s not always that simple. There are other causes that have played a role in this scenario.  At this point in time it is important to challenge the concept of the linear connection of causes and keep searching for more.

The “Every Time Statement”

A useful tool to apply in this scenario is an “Every Time Statement.” The statement itself should be absolute in the sense that all causes in the connection need to be present. The same effect should happen each time the action occurs.

 So, every time you kick the object off the platform it will fall? No, not every time.

Why not?  Because, the object in question must be elevated. If you kick it while it is on the ground it will not fall.

So is this an action cause or a condition cause?

It is a state of where the object was at the time it was kicked. So in this instance this cause would be labelled as a condition.

Now that another cause has been identified, you can repeat the “Every Time Statement.”

Every time you kick the object off the platform and the platform is elevated, the object will fall. Every time?  Well, it will only be true if there is gravity in play. If there is no gravity present, then this statement will not be true. 

Is gravity an action or a condition? It’s not an event, it just exists. It was there when the problem occurred. This means that we would label this cause as a condition.

There are now three causes in this causal relationship, but have we identified every cause in that causal connection? At this point we have:

  1. Kicked object off platform
  2. The platform was elevated
  3. Gravity was present

Will the object fall every time?  Only if the object has a mass which is greater than that of air. If it were lighter than air, then it would not fall.

Is this cause an action or a condition? Again we observe that the object’s mass didn’t change. Its mass was what it was before the incident and had been so for some time. This makes this cause a condition.

Encourage people in the RCA group to actively look for the exception that makes a lie out of the “Every Time Statement.”  Every time you find an exception to this statement you have effectively identified another cause. Add it to your list of causes and repeat the “Every Time Statement.” When you can’t identify any other exceptions then you should have effectively identified every cause in that causal connection. The statement should now be absolute.

So what we have identified here is that there are at least four causes in this causal relationship that will influence whether an object will fall or not. In fact, every time something falls the same types of causes will be in play. The action cause will still need to occur, but this may come in different forms. The action can be different but it will still make use of the available conditions.

image_2.png

To Sum Things Up

It is valuable to be able to label causes as either actions or conditions. The process of labelling causes demands that you find multiple causes for each connection. This in itself will challenge your understanding of the problem.

Understanding what the conditional causes are will also lead you to finding the most effective solutions for your problem - the hard controls. By actively engaging in challenging the logic of each and every connection within the cause and effect chart consistently, many more conditional causes will be found and more options of control will present themselves. When you have the ability to eliminate a conditional cause, substitute it, or engineer it out, then your solutions and their outcomes will be more consistent, reliable, and predictable. You can therefore, with a fair degree of certainty, declare that the problem will not recur.

publictraining.png

Topics: root cause analysis, rca success, rca skills, critical rca skills, root cause analysis tips

How to Avoid the RCA Corrective Action Graveyard

Posted by Jessica Peel on Wed, Jun 22, 2016 @ 03:06 AM


Many of us have them. The invisible “graveyard” where good intentions (AKA – corrective actions from your root cause analysis investigation) went to die.

How do they end up there? bigstock-Spooky-old-graveyard-at-night-71555167.jpg

We all know that all the time and money spent on a root cause analysis investigation and identifying solutions is worthless if the solutions are not implemented. An investigation can usually be done within a week but solutions can take much longer to implement. They sometimes require the involvement of multiple teams or departments, regulatory agencies, engineering, planning, budgeting, and the list goes on and on. For these reasons, it can be challenging to stay on top of all the corrective actions you identified in your investigation, who’s responsible, and the status of an action item at any given time.

We can offer a few basic tips that will give you a head start in tracking action items effectively:

  • Be clear about who is responsible for each corrective action. You don’t want to create the opportunity for people to be able to pass the buck with “I thought Bob was going to do it”.
  • Have a mechanism in place by which the implementation of corrective actions can be tracked.
  • Give ownership of a solution to an individual, not a group or department.
  • Assign a due-date for each corrective action.
  • Support people in their efforts to implement corrective actions.
  • Make sure you follow up on each corrective action – check back with the individual responsible to make sure that progress is being made.

But even these “basics” are easier said than done.

In reality, most likely you come out of your root cause analysis investigation with a list of action items for which various people are responsible. Then everyone goes about their regular workdays and may or may not remember to follow through on any additional tasks they were assigned. Even if you have an appointed person to follow up with the action items and make sure they’re on track, it can be difficult to keep up with who has done what. Many managers rely on an Excel spreadsheet to manually track what has and hasn’t been done, due dates, and so forth. But this puts a lot of pressure on one person to keep up with everything – to manually send reminders to folks who haven’t completed their tasks and to enter the information properly when it has been done.

Even when the Excel file has been carefully kept up-to-date, it often lives locally on the manager’s hard drive, and other members of the team don’t have any visibility as to what has and hasn’t been done.

Sound familiar?

If your RCA program is starting to mature it may be time to consider an enterprise solution to help you better manage all your investigations.

Corrective action tracking inside of an enterprise RCA tool can help you maintain visibility and accountability by tracking the status of action items and assigned solutions. Team members get sent automatic reminders of incomplete or overdue action items and they can easily update the status of their assigned tasks, instantly informing everyone when a task has been completed. You can also create personalized dashboards with reports showing open, completed, or overdue corrective actions.

austin_plant_generator_backfire.png

In addition to effective action tracking, an enterprise RCA solution can more broadly help your company implement and manage an effective overall root cause analysis program.

Here are some of the main features to look for:

Enterprise-wide visibility of your RCA program
Expand the RCA knowledge base and accessibility across an organization.
 
Search across the database for past RCAs, solutions, causes, equipment items, etc
Leverage information from previous investigations in your current investigation.
 
Classify problem-types by company or industry standards or by a pre-set list
Classify and tag files for easy search-ability. Create custom tags incorporating company or industry standards.

Create and share interactive KPI reports
Build reports on your chosen metrics and visually display key performance indicators in tables, charts and graphics.
 
Create personalized dashboards
Specify which reports are most important to you for immediate dashboard display on your home page.
 
Save and embed reference files such as photos equipment failure data, interviews, etc
Preserve integrity by securely collecting and storing evidence and important reference files.
 
House internal company resource documents and tools
Store company corporate standards or reference files such as frequently referenced industry documents in a central location for immediate access when facilitating an RCA.
 
Progress updates
Communicate with all users through on-page messaging that lets you quickly share information, receive feedback and record comments.
 
Keeping your RCA investigation corrective actions out of the graveyard is a very common challenge in maturing RCA programs, but it’s just one of many. To see what you may be up against in the future, check out our free eBook, “7 Challenges to Implementing Root Cause Analysis Enterprise-Wide and How to Overcome Them”.

Remember, in order to resurrect your RCA investigation corrective actions, start with the basics that we listed at the beginning of this article. But also keep in mind – the more mature your RCA program becomes, or the larger and more complex your organization, the larger and more complex your problems become. So when you’re ready to alleviate this pain point altogether, consider whether an enterprise RCA solution might be the next step in your program’s development.

EnterpriseSolution20MinDemo_banner_V1.jpg

Topics: root cause analysis, rca skills, rca facilitation, corrective actions

Practical Tips: Preparing to Lead an RCA Investigation

Posted by Jessica Peel on Thu, Apr 21, 2016 @ 06:04 AM

 Click on the infographic for a PDF version. 

Practical_Tips_Thumbnail_Image.jpgPracticalTips-PreparingToLeadAnRCAInvestigation_FINAL_2.jpg

ApolloRCAMethod_BlogBanner_600x285.jpg

Topics: root cause analysis, RCA Investigation

3 Simple RCA Facilitation Tips

Posted by Jessica Peel on Wed, Mar 02, 2016 @ 06:03 AM

3SimpleTips_Banner_600x286_V2.jpg

“How long should an RCA take?”

This question is similar to how long is a piece of string?

I have heard one manager in a plant that has stipulated a maximum of two hours for an RCA to be conducted in his organisation. Another expects at least “brainstormed” solutions before the conclusion of day one – within 6 or 7 hours.  It is not uncommon for a draft report to be required within 48 hours of the RCA.

The following three tips may assist to meet tight deadlines and when time expectations are short. One advantage of the Apollo Root Cause Analysis methodology is that it is a fast process but the “driver” has to be on the ball to achieve the desired outcomes – effective solutions.

Tip #1 You Define The Problem

Imagine the RCA has been triggered by an unplanned incident or event which falls into any of the safety, environment, production, quality, equipment failure or similar categories. You have been appointed as the facilitator by a superior/manager who is responding to the particular event. Your superior/manager may understand the trigger mechanism and may well nominate the problem title.

For example, “upper arm laceration”, “ammonia spill”, “production delay” and so forth could be the offering you make to the team as the starting point for the analysis. Typically, as facilitator you will have gathered some of the “facts” from first responder reports, interviews, data sheets, photographs and so on.  So a good first step is to draft a problem definition statement, including the significance reflected by the consequences or impacts. The team then has a starting point to commence the analysis, albeit the problem statement may change as more detail is provided.

Ideally, you will have already created a file in RealityCharting™ and the Problem Definition table can be projected onto a screen or even onto the clear wall where your charting will be done with the Post-It™ notes. The team members’ information ought to have been entered and can be confirmed quickly in this display. You might even show the Incident Report format and focus on the disclaimer option you have selected deliberately: Purpose: To prevent recurrence, not place blame.

This preparatory work could save at least 20 minutes of the team members’ time and enable an immediate launch into the analysis phase. 

Important: Save yourself hours of re-work and potential embarrassment by saving the file as soon as this first process is complete, if you haven’t already done so, and thereafter on a regular basis. Maintain some form of version control so that the evolution of the chart in the following day/s can be tracked if necessary.

If you are particularly well-resourced the chart development might be recorded on the software simultaneously as the hard copy is created on the wall space. A small team might choose to create the chart directly via the software and a decent projection medium.

 Tip #2 Direct The Analysis 

It is critical that your initiative in preparing the problem definition is not considered by the team members as disenfranchising them. The analysis step whereby all have an opportunity to contribute should ensure that they feel they have “ownership” of the problem.

To reinforce this, it is advisable to choose a sequence of addressing each member, typically from left to right or vice-versa depending on the seating arrangements. This establishes the requirement that one person is speaking at a time, secondly, that each and every statement will be documented and thirdly, that every person has equal opportunity. Your prompt and verbatim recording of each piece of information will provide the discipline required to minimise idle chatter which can waste time because it distracts focus. When you have a series of “pass” comments from team members because the process has exhausted their immediate knowledge of events, launch the chart creation. 

It is worthwhile reminding the team that each information item that has been recorded and posted in the parking area, may not appear in their original form on the chart or at all, in some cases. Because the information gathering is a widespread net to capture as much knowledge regarding what happened, when and why, there will be no particular focus. But because they are coming from people with experience and expertise or initimate knowledge of events and
circumstances, they have some value. The precise value will be determined by where the information sits in the cause and effect logic that starts at the problem and is connected by “caused by” relationships. 

Important: Cause text should be written in CAPITAL LETTERS. It will be easier to read/decipher for the team at the time and perhaps from photographs of the chart later. Similarly using caps in the software itself means that projection of the chart is more effective and the printing of various views is enhanced.

 Tip #3 The "How and If" of Creating a RealityChart

Many proponents tap the existing understanding of the event by capturing as many of the action causes as possible. These may arrive via a 5 WHYS process, for example, which starts at the Primary Effect.

            Plant Stopped (Problem or Primary Effect)

            Why? Feed pump not pumping

            Why? Broken Coupling

            Why? Motor Bearing Seized

            Why? Bearing race Collapsed

            Why? Fatigue

The Apollo RCA method requires use of the expression “caused by?” to connect cause and effect relationships. Understanding that there must be at least one action and one condition helps  reveal the “hidden” causes and especially the condition causes which do not come to mind initially.

To support this expression and the essential “why”, consider asking “how”. This may be  employed initially by the most impartial member of your team who has been engaged specifically because of his/her lack of association with the problem and can sincerely ask the
supposedly “dumb” questions. Invariably these questions generate more causes or a more precise arrangement of the existing causes. A “How does that happen exactly?” question can drive the team to take the requisite “baby steps”.  This also often exposes differences between “experts” and the resolution of these differences is always illuminating.

The facilitator needs to be aware of the need to softly “challenge” the team’s understanding while ensuring the application of sufficient rigour to generate the best representation of causal relationships. This can be done in a neutral manner by using the “IF” proposition.

Given that every effect requires at least two causes, you can then address the team with the proposition: “If ‘one exists’ and ‘three exists’ (two conditions) then with ‘four added’ (the action) will the effect be “eight” every time?”. Using this technique on each causal element will generate the clarity and certainty being sought to understand the causes of the problem. If every “equation” (causal element) in the chart is “real” and the causes themselves are “real”
(substantiated by evidence) then the team is well-placed to consider the types of controls it could implement to prevent recurrence of the problem.

The more causes which are revealed the more opportunities the team has to identify possible solutions.

 Summary

To speed up the RCA process,

Step 1 Facilitator gathers event information and fills out Problem Definition Statement.

Step 2 Facilitator directs the Information gathering casting a wide net and systematically requests information from participants.

Step 3 Use information gathered to build a RealityChart™ with actions based on what happened then looking for other causes such as conditions which may initially be hidden. Use how and If to help validate that causal relationships are logical.

With a completed chart the solution finding step can begin.

training footer ad resized 600

Topics: root cause analysis, rca skills, rca facilitation

My Experience Applying RCA Teachings - A Conversation Between Teacher and Student

Posted by Jessica Peel on Fri, Feb 05, 2016 @ 09:02 AM

ApplyingRCATeachings_Banner_600x286.jpg

Creating a common reality is a part of the foundation of the Apollo Root Cause Analysis methodology.  It is important that language and definitions are consistent among all parties involved. When the Apollo Root Cause Analysis methodology is applied correctly everyone who participates truly understands the value of the problem, what the solutions are and how they will affect the problem.

Establishing a universal reality is a bigger challenge than you might think. No one shares the exact same experiences or interprets information in the exact same manner. Good problem solvers know to take these different perspectives into account as they forge a path to the solutions.

Just as individuals apply their own unique perspective when conducting specific RCAs, companies apply their unique organizational culture when implementing an RCA process.  Establishing company standards by defining an RCA champion with clear expectations and implementation procedures in place will keep your organization on the path to RCA success.

Another way to stay at the top of your game is to learn from the experiences of industry peers.  Here we take a look at a conversation between Tom, an Engineering Team Lead and RCA champion and Jack, an expert Apollo Root Cause Analysis methodology instructor. 

Tom (Engineering Team Lead): 

I have found that sometimes engineers and technicians do not have a real understanding of the meaning of “root cause.” They tend to think of it as a single poor design feature or failure like a “loose nut” or a single cause of the issue or failure. They seemed to be surprised when I recently identified ten root causes on the last job. They were confused and could not get their heads around having ten root causes. They said, “But what was the real single root cause?”

Jack (RCA Instructor):

You are so right. Many people have preconceived idea that there can only be one root cause. They are driven by this perception to that end. It is quite a limiting concept for those people. They can become quite tunneled in their thinking, offering a close-minded approach to their problems rather than an all-embracing search for knowledge and information that could lead to enlightenment. Some anecdotal information even suggests that this mind frame is taught and it quite difficult to rattle their cages and try to shift their paradigms. How do you define root cause?

Tom:

I define root cause as an opportunity for improvement. A single root cause cannot exist on its’ own, there must also be at least one condition. Here, I cannot come across as too much of a know-it-all or people roll their eyes, so I need a quick snappy go to response that is quick and brief and simple and does not come across as a nerd or a geek. That’s just where I work, as there are no formal RCA people in this division – we all share the work on investigations and most are engineering failure investigations that I do out of my own volition, and share with my team.  In your experience, what are the major setbacks you have seen with people applying the RCA process? I’d like to get better and avoid these mistakes.

Jack:  

You are doing a great job, persevere. Changing peoples’ perspectives takes time especially if you are the only one flying the flag. A major key to success is making sure you are asking enough questions and following a process that demands these questions be asked. Sometimes people take shortcuts to speed up the process…less to think about…less time…must be better! And they can still argue that they have a solution. For simple problems this may even work and they could achieve a satisfactory result, but for complex problems this approach simply doesn’t come close to being comprehensive enough. The lack of knowledge and training in this area now comes back to bite them and their problems invariably don’t go away. Without a solid RCA foundation and process in place the structures within the company they work for won’t raise any red flags that something may be incorrect or ineffective in any way….so the end product of a subpar RCA (the report) is accepted.  If management doesn’t embrace the change then reverting to old acceptable habits is just easier. The key to avoiding these major failures lies in overcoming the resistance to change.  Involving your team in the RCA process and sharing your successes with management is a great way to gain support.

Tom:

I got into the habit of now actually doing an initial draft RCA live in front of my team. I draft the RCA in a bound book which I have dedicated to this purpose and follow the cause and effect pathways like the software. I feel like this approach is more relatable with my team and I am able to get their input quickly. We are usually able to identify half a dozen possible causes in just a few minutes.  Afterwards I go to the software and expand on it. Then I formalize and save the RCA in the software which checks all my work.  

Hope you are in Sydney sometime soon, Jack. Your teaching techniques really work and I liked your style. I think in 20 years of taking training your lessons are the ones that have stuck the most with me.


If you have linkedin_banner.jpgquestions or ideas to share and would like to connect with people who have been trained in the Apollo Root Cause Analysis methodology with ARMS Reliability join our Apollo Root Cause Analysis methodology discussion group on LinkedIn. 


Topics: root cause analysis, rca skills, rca facilitation

The Anatomy of a Perfect Executive Summary for an RCA

Posted by Jessica Peel on Tue, Jan 05, 2016 @ 07:01 AM

 Click on the infographic for a PDF version. 

TheAnatomyofaPerfectExecutiveSummaryforanRCA_Infographic_Header_Image.jpgTheAnatomyofaPerfectExecutiveSummaryforanRCA_Infographic_Body.jpg 


Training_Calendar_Banner.png

Topics: root cause analysis, executive summary

RCAs Don't Need To Take Several Days

Posted by Kevin Stewart on Tue, Dec 08, 2015 @ 04:12 AM

By Kevin Stewart

Many of the Apollo Root Cause Analysis methodology training instructors often get asked the same question – “how long should it take to do a Root Cause Analysis (RCA) investigation?”  This is a difficult question to answer due to the variables associated with each individual RCA.   It’s a lot like asking someone, “How long will the trip take?”  How do you begin to answer that? Some questions that come to mind are – to where? Or how will you be traveling? Or what route will you take?  Or will you be stopping anywhere? And so on.

If it is so variable, how can we even talk about whether an RCA should take several days or not?  There are two general paths in the utilization of the Apollo methodology, let’s call them “long” and “short.” Since this article is about RCAs not taking several days, let’s focus on the short one. bigstock-Calendar-And-Clock-Time-Circle-83476289.jpg

Most people envision the Apollo Root Cause Analysis methodology as a large group of people in a conference room for several days as a necessary means to finding a valid solution.  It is true that many RCA investigations do take four to five solid, eight-hour days to determine an appropriate solution, but these should be problems that have a large significance where information may not be readily available.

I always point out to my students that not only is it possible to do an Apollo Root Cause Analysis in a short time, but I have personally done several that took less than a day.  How? 

The Apollo Root Cause Analyisis process involves a specific methodology of asking “why?” or “caused by ____?” and then identifying an appropriate answer, writing it down, and then asking “why” again.  You do this until you are stymied with no answers or reach a point where it doesn’t make sense to ask “why” anymore.  This process does not change regardless of the type or the size of the problem, or for any other reason. 

Many of you may have heard of the “Five Whys” as an RCA process.  This was designed for small problems experienced by operators on the line at Toyota facilities.  These little RCAs were done in the moment by people involved in the incident.  If you’re familiar with both the Apollo Root Cause Analysis methodology and Five Whys process you may notice that they are very similar. Many times I point out to students that you can see several “Five Whys” branches inside any Apollo RCA chart. So it stands to reason that the Apollo Root Cause Analysis methodology can be used in a similar fashion to the Five Whys.

Here’s an example.  I was responsible for the reliability of a production area of a plant during my career.  It was not uncommon to find me walking around looking for problems, and during one such time I discovered some people working hard to unplug a jammed conveyor.  It was plugged with a 1,000-pound solid carbon block wedged in between some posts, and there was no good access to the block with a crane or other lifting device.  When they spotted me I got an earful; apparently this had been happening on a regular basis.  The specific frequency was unknown, but the emotion of the operator told me that it was at least once per shift.  I promised to fix it for him and he calmed down, they got the unit unplugged and back on line, and he went back to his job just downstream of the jam.

Since I promised to fix this, I decided to spend some time at the unit to see if I could observe what was causing the jam.

The Apollo Root Cause Analysis process went like this:

ProblemDefinition_Table.jpg

If you start the RCA chart in your mind, you quickly get to a dead end because no one could see why the jam had happened.  The operator in the area was busy doing his job, which required constant attention—pouring molten metal into a small cavity to “glue” a copper rod to the top of an anode.   This was done while the line was moving; he poured one about every 15 seconds so he really couldn’t be looking around.  There were not a lot of other spare personnel in the area that could spend the time looking, so I decided that was my job. bigstock-Man-in-a-safety-hat-taking-not-64077667_Resized.jpg

These blocks where pushed onto an automated system by a large pusher that had a paddle hanging down from a cylindrical steel piece with a bushing, since the paddle was designed to float.  It seemed pretty obvious that the pusher had something to do with it… but how?  After they started up the system, it worked like a charm just as designed, no glitches.  Intermittent problems are some of the hardest to fix because you need to be there when things go awry or gather data to identify the causes.

So there I was with one cause on my box – “Block jammed caused by ____?” I thought perhaps if I watched it I’d get lucky enough to catch the issue.  So I stood there, and stood there, and stood there for perhaps an hour. Nothing.  I didn’t want to leave quite yet but it did seem like a waste of time, so I decided to check out other items in the area.  I spent an hour or so away from the machine and then went back. Upon returning to the unit there didn’t seem to be anything obviously out of order.  However, something seemed different, though I couldn’t put my finger on it.

After spending another hour away and then coming back again, this time I noticed what appeared to be a difference: slight, but I was pretty sure it was happening.  One more hour away and then back and sure enough something was happening over a long period of time.

Now I just needed to verify my suspicions.  Believing I knew the cause, I figured I had enough time to go to lunch and do some more office work before returning to the unit to check my theory and gather evidence.  I was correct.

The cause of the issue was that the paddle was rotating counter-clockwise on the shaft ever so slightly with every push.  It was taking more than six hours for it to rotate enough to push on the corner of the block, shove it sideways off the conveyor, and cause the jam.  So my chart looked like this after about six to seven hours:

chart_1.pngAt this point I alerted everyone to the issue, and the maintenance personnel came over and safely moved the paddle back so the shift could finish.  Our facility had a swing shift crew that worked in the area after the production was done, so they were assigned the task of fixing the unit.

That evening they removed the unit, checked everything against the drawings and specifications, and found that the tolerance on the bushing was incorrect.  It was close, but the tolerance was tight enough that each push that was not exactly dead-on caused a slight twisting force, moving the paddle off course and eventually causing a jam. The team fixed the tolerance issue and put it back in place by the next shift start. 

So my chart now looked like this:

chart_2.png

This whole process took less than eight hours to complete but was spread out over two days.  If you look at my total time involvement it was perhaps four hours. (I am not charging the process with time that I was multitasking by doing other things.)

So as you can see, an RCA investigation doesn’t always have to take days.  Of course, some will take several days and you could stretch even a simple investigation into a longer process if you wish. But if you are close to the problem, get accurate information, act quickly, and stick with the process, you can do an RCA quickly and get an effective solution.

FreeRCProDemo_banner.jpg

Topics: root cause analysis, rca skills, rca facilitation

Top 6 Sure-Fire Ways To Derail Your RCA Program

Posted by Jessica Peel on Thu, Nov 05, 2015 @ 07:11 AM

 Use the arrow buttons to click through the slides below. 


Topics: rca success