 Author: Kevin Stewart
At some point, most companies will want to see quantifiable metrics showing that their Root Cause Analysis (RCA) program has resulted in a positive return on investment (ROI).
ROI is relatively easy to calculate as a dollar value when it comes to tangibles such as equipment or production time. Things can seem trickier when trying to assign a dollar value to safety improvements resulting from an RCA program. Try to keep it simple.
This formula -
Cost of the Problem x Likely Recurrence / Cost of the Fix = ROI
is a straightforward way to begin quantifying the ROI of your RCA program, including its effects on safety.
Let’s look at how we might calculate these costs.
Cost of the Fix
- Cost of an RCA investigation (you may need to include the initial training, though this should drop off as it is amoritized out over the program, as well as whatever time, resources, and people are required to conduct the investigation itself).
- Cost of whatever resources are needed to implement a solution. Don’t forget to include new equipment, parts, additional training, and anything else that is directly attributable to the implementation.
When you eliminate a problem, calculating what you have saved depends a lot on the problem itself and what its rate of reoccurrence is. For instance, if you figure out what was causing a particular machine to fail at a rate of once/year, you won’t see the benefits of your solution for another year. It can take several years and solving many different problems to see the total value of an RCA program.
Improved safety isn’t as impossible to quantify as it might seem. While most companies don’t publicly discuss this type of equation because it can seem insensitive, chances are your company does calculate the monetary cost of an injury or death on the job. These figures may be a bit outdated, but the Mine Safety and Health Administration at the US Department of Labor offers an online calculator, which takes into account both direct costs (like workers’ comp claims) and indirect costs (like training a new worker and lower morale), as one example.
Cost of the Problem Reoccurring
Cost of the initial problem in equipment, production delays, man hours, workers’ comp claims, medical costs, absenteeism, turnover, training new employees, lower productivity, decreased morale, legal fees, increased insurance costs.
At first glance the equation doesn’t quite make sense for a safety “near miss.” If it missed then what did it cost? Is the answer nothing? So the ROI is: 0 x likely recurrence/cost of the fix = 0? The answer obviously must include the potential cost. The cost to the business if the issue was on target and hadn’t missed. It all becomes subjective then. How do you put a cost on maybes?
It might help to look at the statistics of how an incident occurs. Take the cost to the business if a single major accident occurred (every business has this unspoken cost locked away somewhere) and then very simply do the math. One near miss will be worth 0.003 of that cost. Tally up your near misses and now go back to the formula.
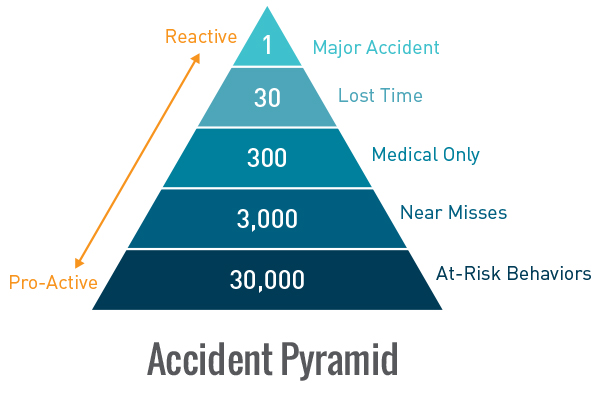
As an example, say your data indicates you have 3000 near misses in two years, or 4.1 incidents per day. Then you put a program in place and now you have 3000 near misses in four years, or 2.1 incidents per day. This translates to 3000 fewer near misses in two years time. Per the above calculations, this would generate 3000 x 0.003 or nine fewer major incidents at whatever cost your company assigns to that type of incident. This becomes the savings for your ROI (or the Cost of the Problem in our equation) and can be attributed to the safety program of which the RCA process is a part.
This formula will assist in calculating an ROI on an individual RCA, which is necessary to show that the process is working and providing value so you can justify the program. However, since most safety programs track TRIR (Total Recordable Injury Rate) or something to that effect, you will also need to show that the RCA program affects this, too. This will be difficult because the safety program is in place and doing other things to prevent safety incidents before they happen. How do you attribute a reduction in near misses to preventive programs versus items put in place from an RCA?
You may never be able to separate these items. Even with detailed records, it is not always clear why people do what they do. The best thing you can do is to track when an RCA program was incorporated and then show the improvement in your safety metric, in TRIR, or near misses.
You can use this information to justify the program with the argument that the RCA process is part of the overall safety program and it really doesn’t matter which gets the credit as long as we have continued to drive safety improvements. The RCA program should be a small part of the overall safety program costs since there are usually several full time safety people involved, committee meetings, safety initiatives, programs, etc.
It doesn’t matter how you slice and dice it, the return on investment for your RCA program boils down to: What will it cost me to fix the problem now? – versus – What is the cost if this problem happens again?